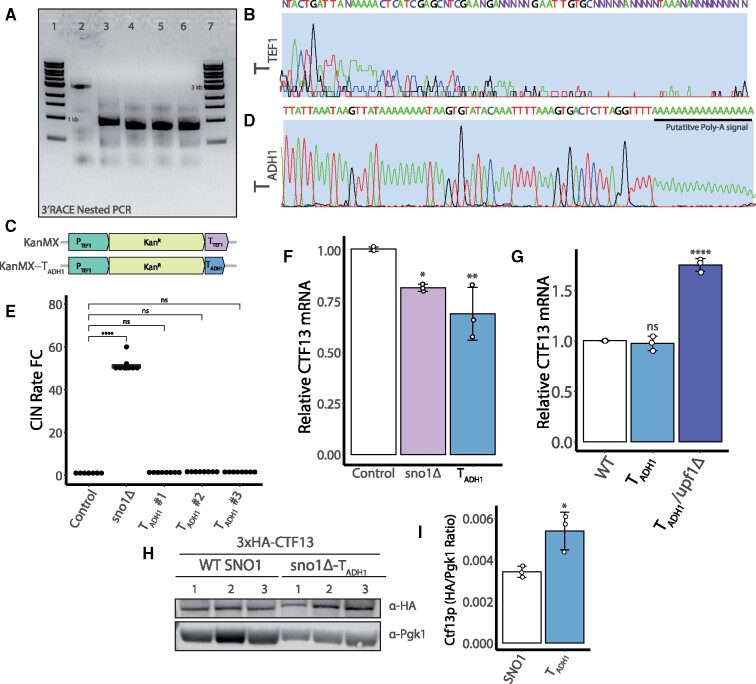
Figure 4.
CTF13 mRNA length and 3′ end composition are altered in the sno1Δ mutant. (A) Nested reverse transcriptase (RT)-PCR products from a 3′ RACE assay using a CTF13 gene specific primer (MRG577) and QI primer (see Supplementary Table S2) run on a 1% agarose gel stained with ethidium bromide. Lanes 1 + 7: 5 μL 1 kb ladder (NEB # N3232L). Lane 2: Control strain, wild-type SNO1-CTF13 locus. Lane 3: sno1Δ::Kan, Lanes 4-6: 3 independent isolates of sno1Δ::Kan-TADH1. All strains were engineered into the qCTF background. (B) Sanger sequencing of gel extracted 3′ RACE PCR products for the sno1Δ strain trimmed to a 76 base pair window within the CTF13 3′ UTR. This includes the final base calls from this sequenced fragment. Purple Ns are reads that could not be accurately assigned using the sangerseqR package in R (Hill et al. 2014). Full Sanger sequencing data is available in Figure S5. (C) Graphical representation of the two plasmids used to generate sno1Δ mutants. Plasmid maps are displayed as linear fragments zoomed into the KanMX promoter, gene, and terminator segment. pFA6a-KanMX (top) contains the TEF1 promoter and terminator (PTEF1 and TTEF1, respectively) sequence from A. gossypii. pFA6a-KanMX-TADH1 (bottom, referred to as MGP026 in Supplementary Table S4) was cloned using the pFA6a-KanMX as a backbone and the TTEF1 was replaced with a 166 base pair ADH1 terminator (TADH1) sequence from S. cerevisiae. Maps drawn to scale. (D) Sanger sequencing of the 3′ RACE product for the CTF13 mRNA in the sno1Δ::Kan-TADH1 strain trimmed to a 78 base pair window within the CTF13 3′ UTR. The putative polyA tail signal is shown underlined in black. Full Sanger sequencing results available in Supplementary Figure S6. A black bar is used to indicate the putative polyA reads from this sequencing experiment. (E) qCTF assay CIN rate measurements from three independent isolates of the sno1Δ::Kan-TADH1 (TADH1 #1-3) strain and sno1Δ strain. P-values are generated from a Tukey’s post hoc test. (F) qPCR analysis of CTF13 mRNA levels performed on control, sno1Δ, and sno1Δ::Kan-TADH1 (TADH1) strains using a CTF13 ORF primer sets (set #3, see Supplementary Table S3). Three independent replicates were performed with technical triplicates. Each values is normalized to the level of ACT1 mRNA. Technical triplicates are averaged and pooled together and standard deviation is calculated for means of the independent strains. P-values are generated from a Tukey’s post hoc test. (G) qPCR analysis of CTF13 mRNA levels expressed as fold changes performed on control and sno1Δ::Kan-TADH1 (labeled TADH1 for shorthand) in the presence and absence of functional NMD using a CTF13 ORF primer set (set #3, see Supplementary Table S3). Three independent replicates were performed each including technical triplicates. Each values is normalized to the level of ACT1 mRNA. Technical triplicates are averaged and pooled together and standard deviation is calculated for means of the independent strains. Statistical analysis is generated from a Tukey’s post hoc test. (H) Western blot analysis for 3xHA-CTF13 protein levels in a SNO1 WT background or a sno1Δ::Kan-TADH1 background. Pgk1 was used as a loading control for quantification in Figure 4I. Exposure times were as follows: 5 min and 10 s for α-HA blot, 1 min and 2 s for α-Pgk1 blot. Uncropped membrane images including the molecular weight are provided in Figure S8E). (I) Quantification of the membrane shown in Figure 4H. Ratios between the HA and Pgkl signal were determined using Image Studio Lite. Statistical analysis was performed using a Tukey’s post hoc test and error bars represent the standard deviation.

