. 2021 Apr 21;10:e65541. doi: 10.7554/eLife.65541

Figure 1. BonVision's adaptable display and render configurations.

(A) Illustration of how two-dimensional textures are generated in BonVision using Mercator projection for sphere mapping, with elevation as latitude and azimuth as longitude. The red dot indicates the position of the observer. (B) Three-dimensional objects were placed at the appropriate positions and the visual environment was rendered using cube-mapping. (C–E) Examples of the same two stimuli, a checkerboard + grating (middle row) or four three-dimensional objects (bottom row), displayed in different experimental configurations (top row): two angled LCD monitors (C), a head-mounted display (D), and demi-spherical dome (E).

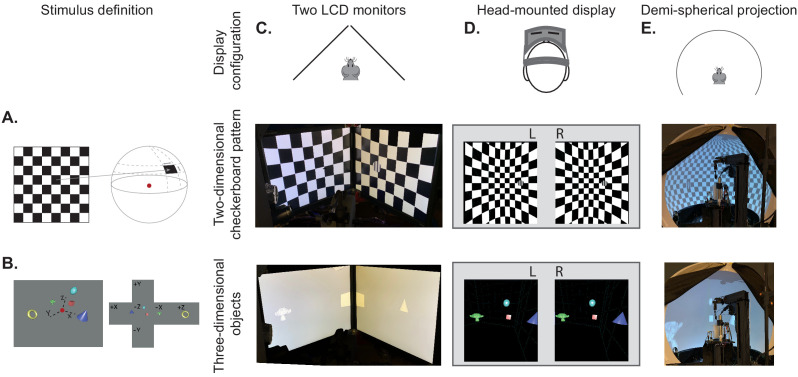
Figure 1.

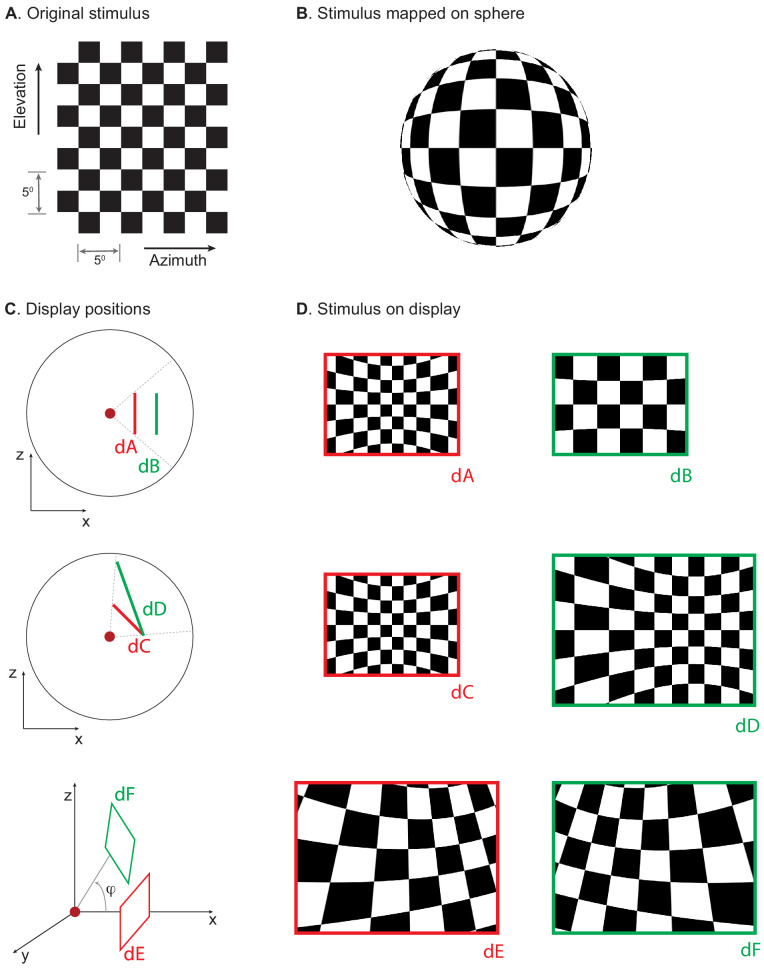
Figure 1—figure supplement 1. Mapping stimuli onto displays in various positions.

Figure 1—figure supplement 1.

(A) Checkerboard stimulus being rendered. (B) Projection of the stimulus onto a sphere using Mercator projection. (C) Example display positions (dA–dF) and (D) corresponding rendered images. Red dot in C indicates the observer position.

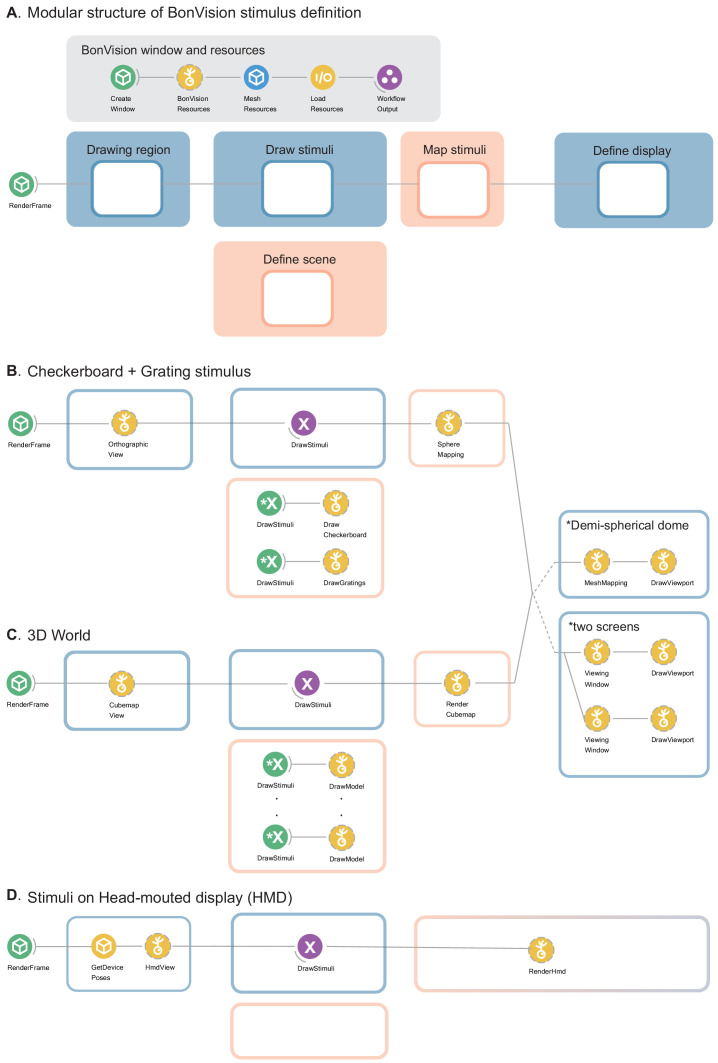
Figure 1—figure supplement 2. Modular structure of workflow and example workflows.

Figure 1—figure supplement 2.

(A) Description of the modules in BonVision workflows that generate stimuli. Every BonVision stimuli includes a module that creates and initialises the render window, shown in ‘BonVision window and resources’. This defines the window parameters in Create Window (such as background colour, screen index, VSync), and loads predefined (BonVision Resources) and user defined textures (Texture Resources, not shown), and 3D meshes (Mesh Resources). This is followed by the modules: ‘Drawing region’, where the visual space covered by the stimuli is defined, which can be the complete visual space, 360° × 360°. ‘Draw stimuli’ and ‘Define scene’ are where the stimulus is defined, ‘Map Stimuli’, which maps the stimuli into the 3D environment, and ‘Define display’, where the display devices are defined. (B and C) Modules that define the checkerboard +grating stimulus (B) shown in the middle row of Figure 1 and 3D world (C) with five objects shown in the bottom row of Figure 1. The display device is defined separately and either display can be appended at the end of the workflow. This separation of the display device allows for replication between experimental configurations. (D) The variants of the modules used to display stimuli on a head-mounted display. The empty region under ‘Define scene’ would be filled by the corresponding nodes in B and C.