. 2021 Apr 21;10:e65541. doi: 10.7554/eLife.65541

Figure 2. Automated calibration of display position.

(A) Schematic showing the position of two hypothetical displays of different sizes, at different distances and orientation relative to the observer (red dot). (B) How a checkerboard of the same visual angle would appear on each of the two displays. (C) Example of automatic calibration of display position. Standard markers are presented on the display, or in the environment, to allow automated detection of the position and orientation of both the display and the observer. These positions and orientations are indicated by the superimposed red cubes as calculated by BonVision. (D) How the checkerboard would appear on the display when rendered, taking into account the precise position of the display. (E and F) Same as (C and D), but for another pair of display and observer positions. The automated calibration was based on the images shown in C and E.
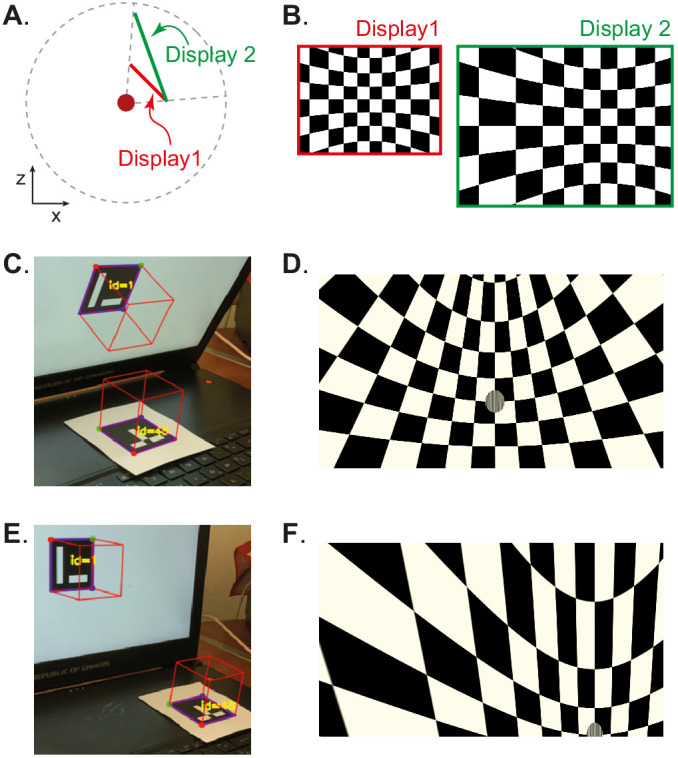
Figure 2.

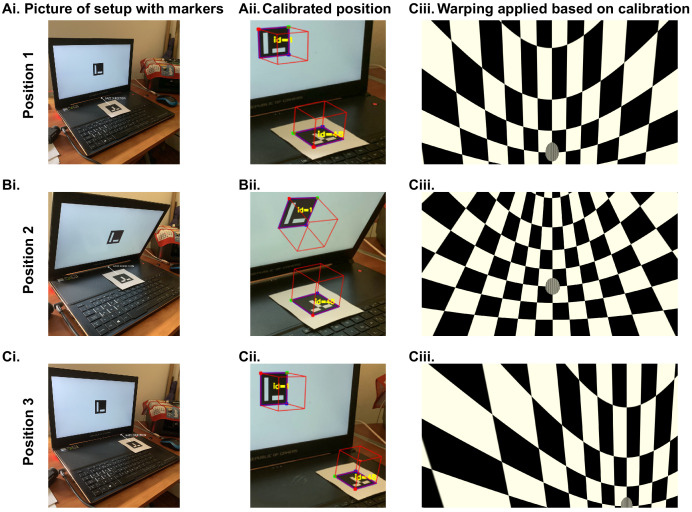
Figure 2—figure supplement 1. Automated workflow to calibrate display position.

Figure 2—figure supplement 1.

The automated calibration is carried out by taking advantage of ArUco markers (Del Grosso and Sirota, 2019) that can be used to calculate the 3D position of a surface. (Ai) We use one marker on the display and one placed in the position of the observer. We then use a picture of the display and observer position taken by a calibrated camera. This is an example where we used a mobile phone camera for calibration. (Aii) The detected 3D positions of the screen and the observer, as calculated by BonVision. (Aiii) A checkerboard image and a small superimposed patch of grating, rendered based on the precise position of the display. (B and C) same as A and C for different screen and observer positions: with the screen tilted towards the animal (B), or the observer shifted to the right of the screen (C). The automated calibration was based on the images shown in Ai, Bi, and Ci, which in this case were taken using a mobile phone camera.

Figure 2—figure supplement 2. Automated gamma-calibration of visual displays.
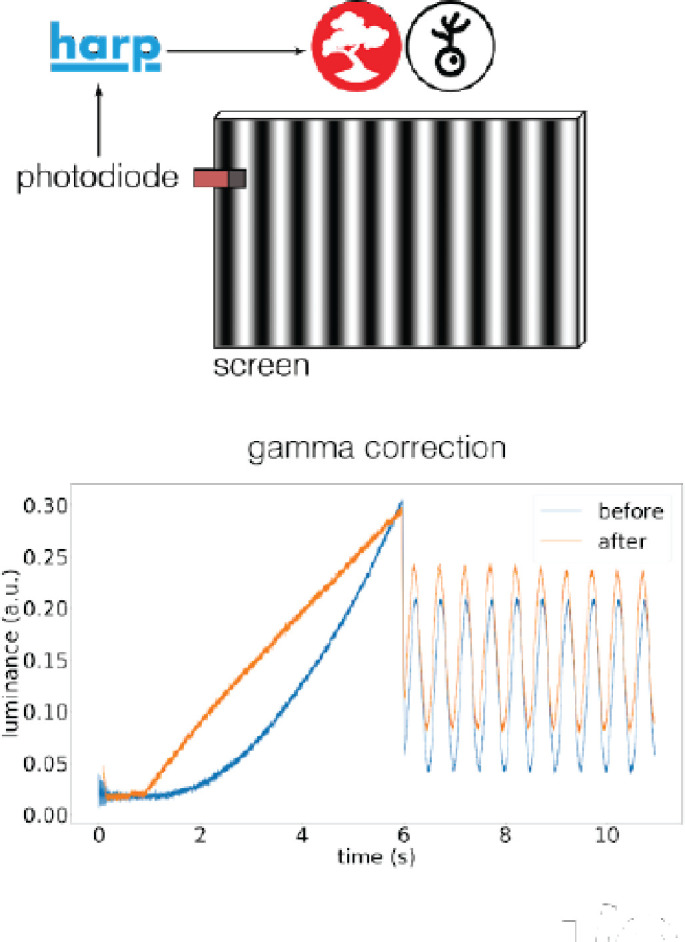
Figure 2—figure supplement 2.

BonVision monitored a photodiode (Photodiode v2.1, https://www.cf-hw.org/harp/behavior) through a HARP microprocessor to measure the light output of the monitor (Dell Latitude 7480). The red, green, and blue channels of the display were sent the same values (i.e. grey scale). (A) Gamma calibration. The input to the display channels was modulated by a linear ramp (range 0–255). Without calibration the monitor output (arbitrary units) increased exponentially (blue line). The measurement was then used to construct an intermediate look-up table that corrected the values sent to the display. Following calibration, the display intensity is close to linear (red line). Inset at top: schematic of the experimental configuration. (B) Similar to A, but showing the intensity profile of a drifting sinusoidal grating. Measurements before calibration resemble an exponentiated sinusoid (blue dotted line). Measurements after calibration resemble a regular sinusoid (red dotted line).