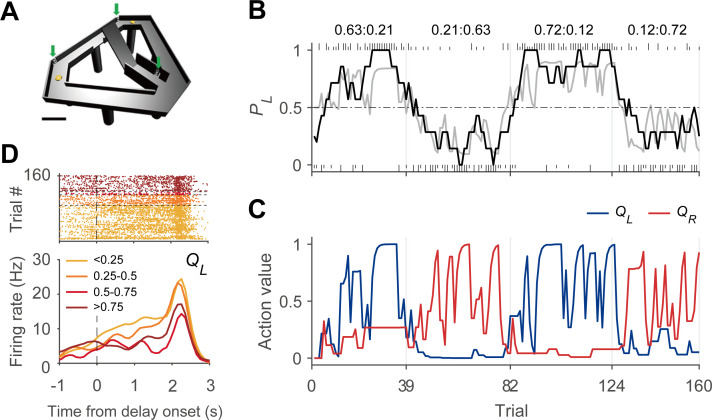
Figure 1. Dynamic foraging task.
(A) Modified T-maze. Rats chose freely between two targets (orange circles) to obtain water reward. Rats navigated from the central stem to either target and returned to the central stem via the lateral alley to start a new trial. A delay (2–3 s) was imposed at the beginning of a new trial by raising the central bridge. Green arrows, photobeam sensors. Scale bar, 10 cm. (B) Behavioral data from a sample session (Kim et al., 2013). The black curve shows the probability to choose the left target (PL) in moving average of 10 trials. The gray curve denotes the probability to choose the left target predicted by the Q-learning model. Tick marks denote trial-by-trial choices of the rat (upper, left choice; lower, right choice; long, rewarded trial; short, unrewarded trial). Vertical gray lines denote block transitions and numbers above indicate reward probabilities of the left and right targets in each block. (C) Trial-by-trial action values of the sample session computed with the Q-learning model. Blue, left-choice action value (QL); Red, right-choice action value (QR). (D) An example DMS unit showing activity correlated with left-choice action value. Trials were grouped into quartiles of left-choice action value. Delay onset is when the rat broke the photobeam sensor on the central stem.

