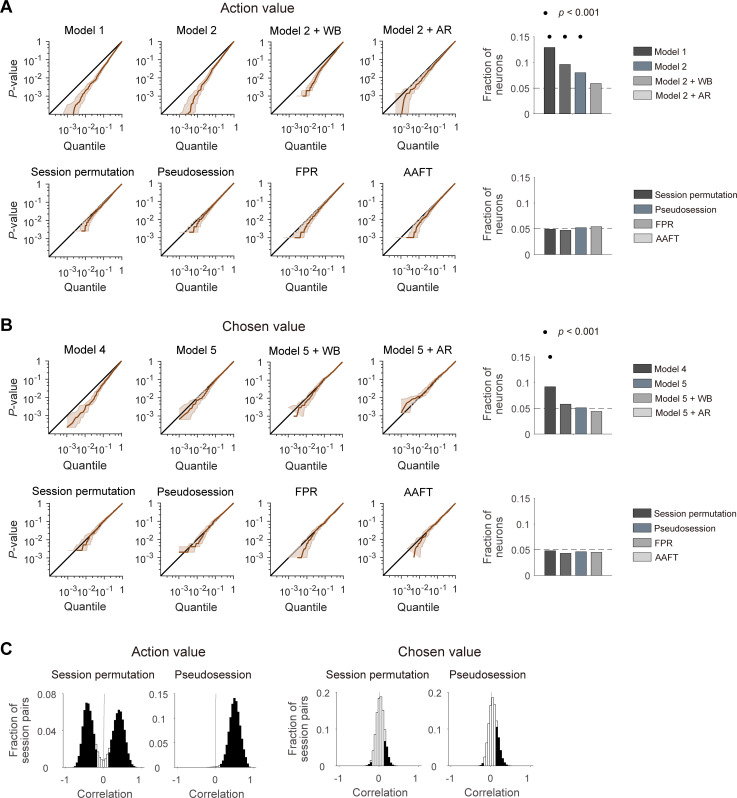
Figure 2. Performances of different statistical tests for action-value and chosen-value signals.
(A) Left, cumulative density functions (CDFs) of p-values for the neural activity related to action value were determined with different analysis methods using null neural data to assess false positive rates. Results obtained with the methods used in previous studies (top), including the t-test in two different regression models (models 1 and 2), within-block permutation applied to model 2 (model 2 + WB), and model 2 with autoregressive terms (model 2 + AR), as well as those obtained with the methods based on surrogate data (bottom) are shown. Right, fractions of neurons significantly responsive to either action value (p<0.025 for QL or QR). Horizontal dotted lines denote 5%. Significant fractions (binomial test) are indicated by black filled circles. (B) Left, CDFs of p-values for the neural activity related to chosen value. Right, fractions of neurons significantly responsive to chosen value (p<0.05 for Qc). The same format as in B, but models 4 and 5 were used instead of models 1 and 2, respectively. (C) Correlation between action values (left) or chosen values (right) calculated from the original and resampled behavioral data either from other sessions (session permutation, n = 382) or simulated behavioral sessions (pseudosession, n = 500). Filled bars indicate significant (t-test, p<0.05) correlations.

