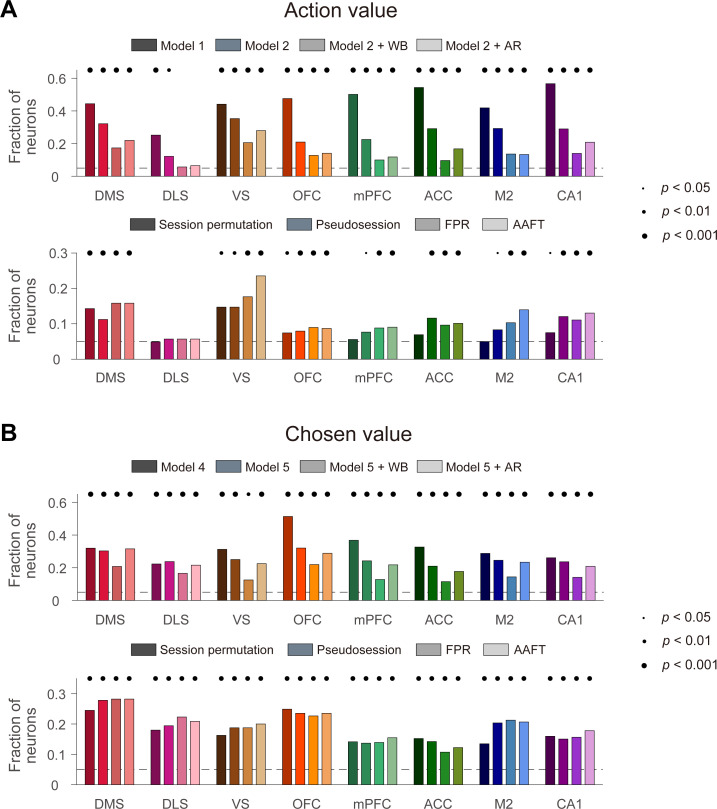
Figure 3. Action-value and chosen-value signals in multiple brain regions.
Action-value and chosen-value neurons were determined based on actual behavioral data and actual neural data recorded from several different areas of the rat brain. Shown are fractions of neurons significantly responsive to either action value (p<0.025 for QL or QR; A) or chosen value (p<0.05 for Qc; B) determined with the previous methods (top) or resampling-based methods (bottom). Significant fractions (binomial test) are indicated by black filled circles.

