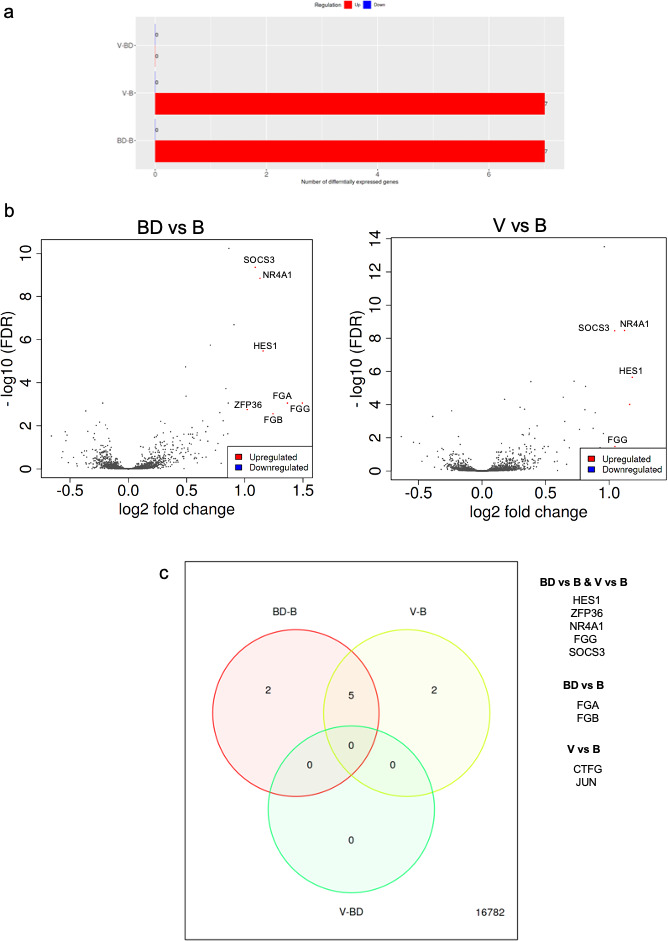
Figure 3. RNAseq analysis of A549 cells cultured in the presence of sera from bonded (B), bond-disrupted (BD), or virgin (V) P. californicus.
(a) Bar graphs showing number of differentially expressed genes in each pairwise comparison group. (b ) Volcano plots showing differentially expressed genes between the B vs BD, and B vs V groups. (c) Venn Diagrams showing overlapping differentially expressed genes. The identity of genes is shown in the right. In the bonded group, mice were paired for 12 months. For the bond-disrupted group, we separated paired mice after 12 months of bonding, and collected the sera 1 week after bond disruption. For virgin mice, we collected sera from mice housed 3/cage.


