. 2021 May 7;10:e62376. doi: 10.7554/eLife.62376

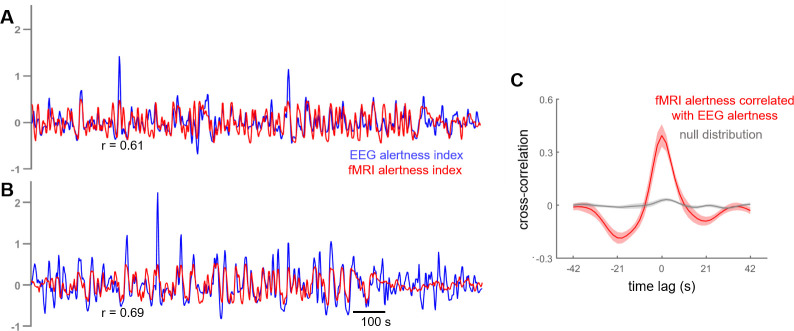
Figure 2. Cross-correlation between estimated fMRI alertness index and measured EEG alertness index.

(A, B) fMRI alertness index (red), superimposed on the EEG alertness index (blue), for two example scans. Note that the EEG data from these scans was not used in the creation of their fMRI alertness time courses, and are only used to evaluate the ability of the fMRI alertness index to track electrophysiological arousal. (C) Temporal cross-correlation between the fMRI alertness index and EEG alertness index (mean ± SE, n = 12 scans; red) together with a null distribution (gray) constructed for statistical comparison (see Materials and methods).

Figure 2.

Figure 2—figure supplement 1. Further analysis of the reliability and across-subject generalizability of the alertness estimation approach.
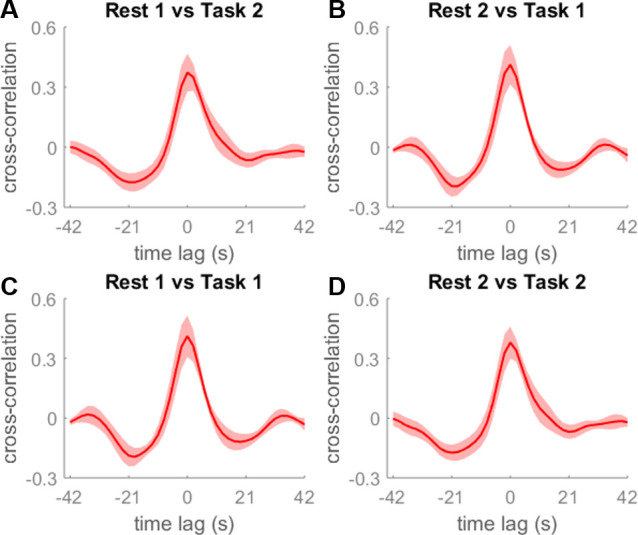
Figure 2—figure supplement 1.

Subjects were broken into sub-groups (Supplementary file 2) such that the two train/test comparisons shown in (A, B) involved disjoint sets of subjects in training and testing.(A, B) Across-subject testing of temporal cross-correlation between the fMRI alertness index and EEG alertness index, across subjects in different groups (mean ± SE, n = 6 scans). (C, D) Between-subject testing of temporal cross-correlation between the fMRI alertness index and EEG alertness index from subjects in the same groups (mean ± SE, n = 6 scans).
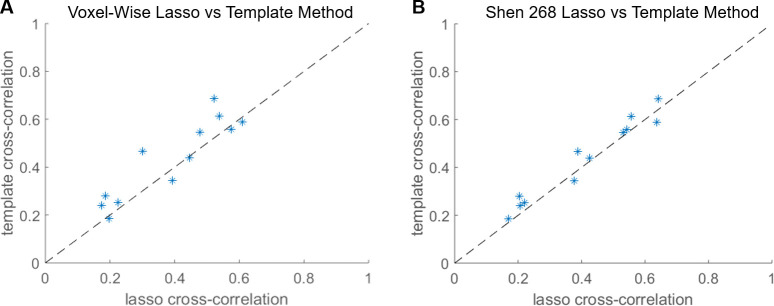
Figure 2—figure supplement 2. Lasso regression model for alertness prediction.

Figure 2—figure supplement 2.

Maximum temporal cross-correlation of the EEG alertness index with the fMRI alertness index, where the latter is predicted from lasso regression models (x-axis of each plot) or the template approach (y-axis). For the lasso, results are shown for models whose input consisted of (A) voxelwise fMRI time courses and (B) ROI time courses extracted from the Shen 268 atlas.
Figure 2—figure supplement 3. Model performance when trained on task data and tested on resting-state data.
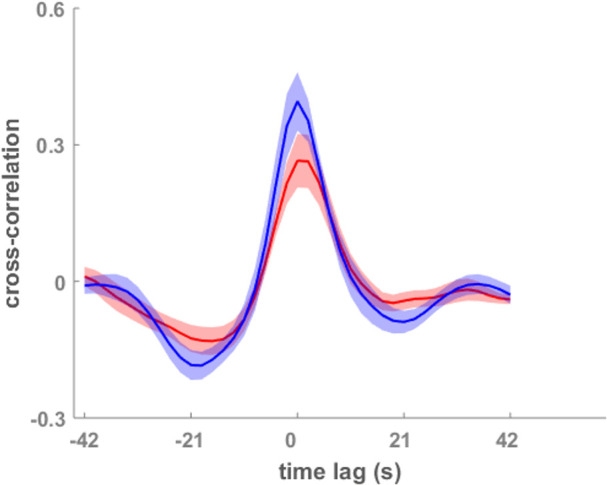
Figure 2—figure supplement 3.

A template map derived from the task fMRI scans was applied to the resting-state data, where the cross-correlation with the EEG alertness index was calculated (red). For reference, the original analysis (in which the template is trained on resting-state data and applied to the task data, also shown in Figure 2C, is superimposed in blue).