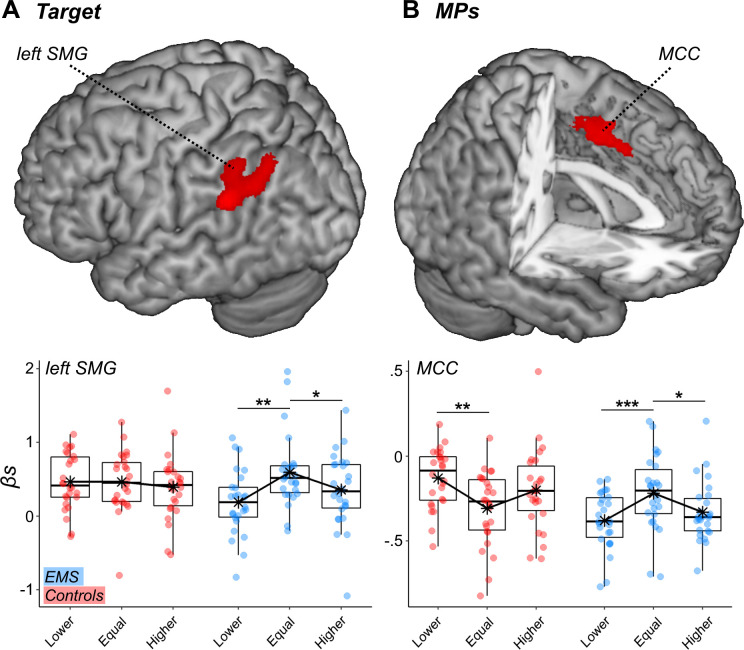
Appendix 1—figure 2. Surface renderings displaying regions showing group differences associated with processing (A) the Target’s and (B) the MPs’ feedback.
Parameter estimates extracted from the outlined regions are displayed separately for Controls (red dots) and EMS (blue dots), and for their relative position (Lower, Equal, Higher) with respect to the initial ratings. All effects are displayed under a height threshold corresponding to p<0.001, with each region surviving cluster-correction for multiple comparisons for the whole brain. Note that feedbacks’ position is displayed across three discrete categories to improve readability, although in the experiment it changed across a continuum (see methods). SMG: Supramarginal Gyrus; MCC: Middle Cingulate Cortex.

