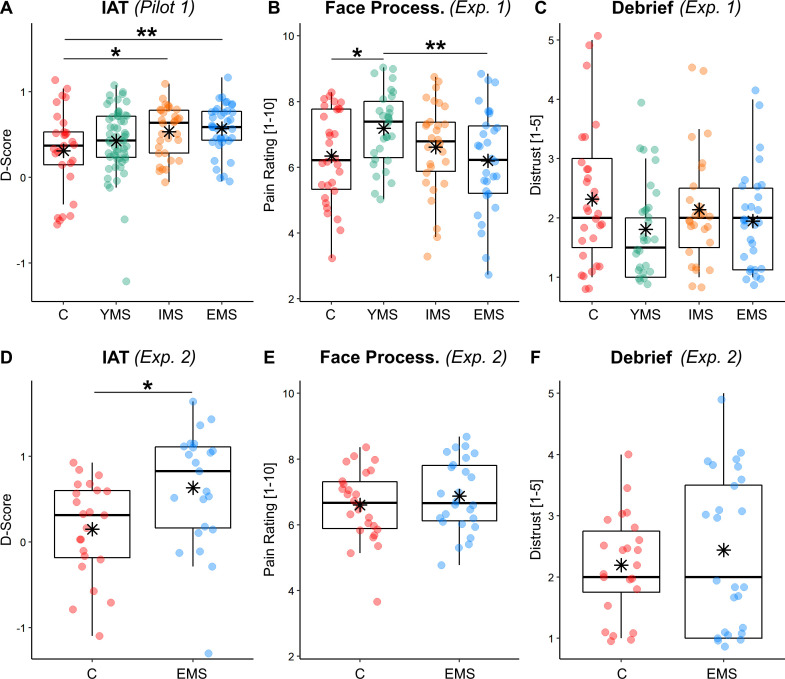
Figure 2. Behavioral Results of IAT and first session.
Boxplots and individual data describing (A–D) the IAT D-score across groups (higher values refer to stronger implicit positive dispositions toward the category of MPs; see Appendix 1); (B–E), Pain Intensity Ratings from first session of the task; (C–F) the Distrust about pain authenticity from the final debrief session. In all plots, data are divided across groups, referring to Controls [C], Young Medical Students [YMS], Intermediate Medical Students [IMS] and Experienced Medical Students [EMS]. For each boxplot graph, the horizontal line represents the median value of the distribution, the star represents the average, the box edges refer to the inter-quartile range, and the whiskers to the data range within 1.5 of the inter-quartile range. Individual data-points are also displayed as dots. '**' and '*' refer to independent sample t-tests associated with p<0.01 and p<0.05, respectively.

