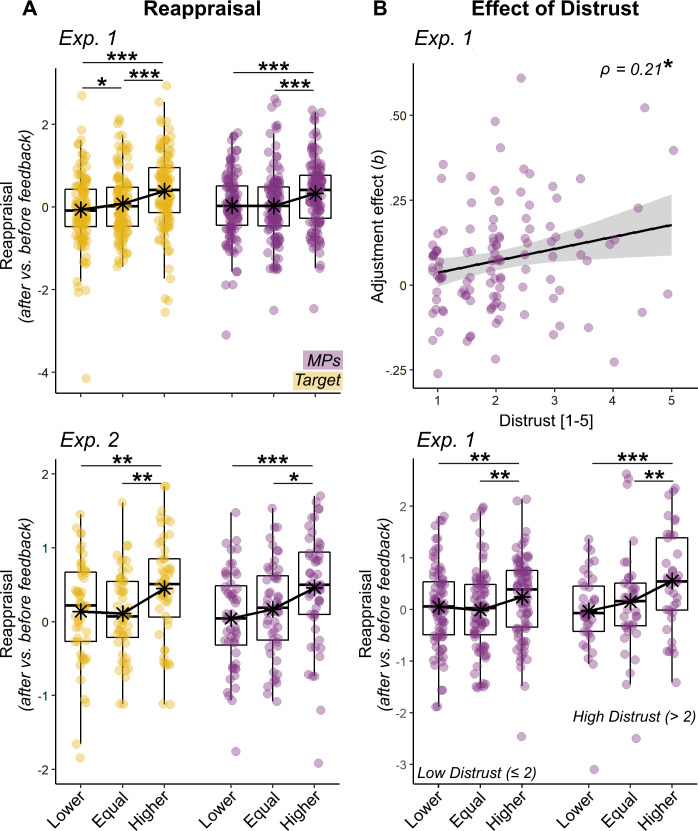
Figure 4. Behavioral Results of Reapprisal and Distrust.
(A) Boxplots and individual data describing the mean. Reappraisal index, resulted from the differential pain rating from two separate sessions (after vs. before presentation of feedbacks). Data are presented separately for Target (yellow dots) and MPs (violet dots) feedbacks, and for their relative position (Lower, Equal, Higher) with respect to participants initial ratings. The top subplot describes the data from Experiment 1, whereas the bottom subplot describes the data from Experiment 2. (B) For Experiment 1, we display also a scatter plot and confidence intervals area describing individual effects of MPs feedbacks’ on Reappraisal plotted against Distrust (top row). Parameters (b) were obtained by a linear regression, similar to that used in the main analysis, but run separately for each individual subject. The higher b, the more the reappraisal is explainable according to the position of a specific feedback. The linear relation is further explored through boxplots displaying the Reappraisal for MPs’ feedbacks, separately for individuals with high/low levels of distrust (bottom row). Note that in all subplots the feedbacks’ position is displayed across three discrete categories to improve readability, although in the experiment it changed across a continuum. ‘***”, ‘**”, ‘*” refer to significance associated with paired t-tests or Spearman’s ρ rank-correlation coefficient at p<0.001, p<0.01, and p<0.05 respectively.

