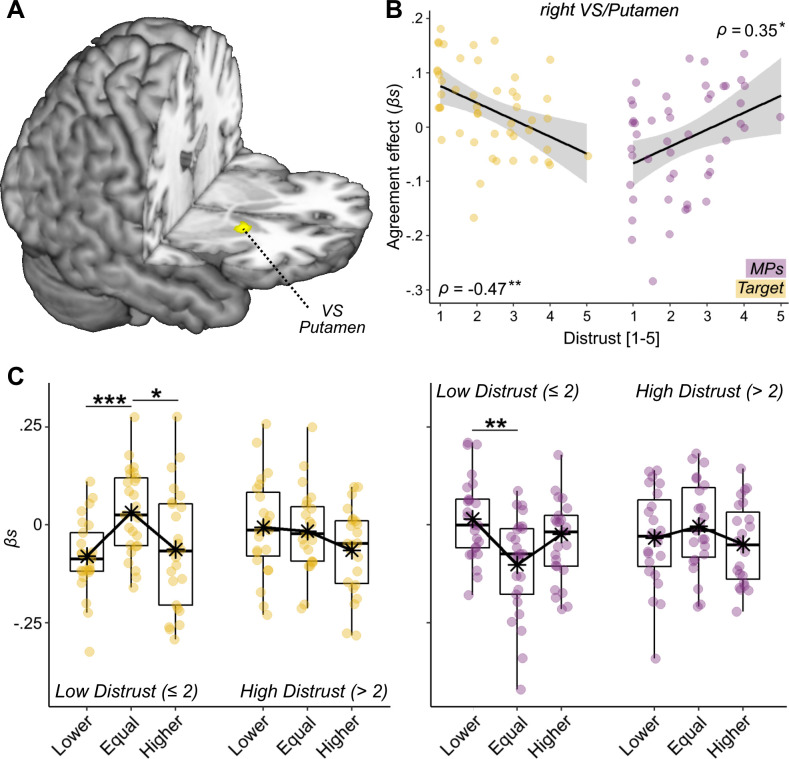
Figure 6. Distrust effect.
(A) Surface rendering displaying the effects of agreement toward the Target feedback interacting with Distrust. The effect is displayed under a height threshold corresponding to p<0.001, and survivse cluster-correction for multiple comparisons for the whole brain. (B) The parameters extracted by the highlighted Ventral Striatum (VS) plotted against Distrust self-reports in a linear regression with confidence intervals area (higher parameters reflect stronger agreement effects). (C) The linear regression is further explored through boxplots displaying VS neural activity separately for Target (yellow dots) and MPs (violet dots) feedbacks, for their relative position (Lower, Equal, Higher) with respect to participants ratings, and separately for individuals with high/low levels of distrust. Parameter plots are associated with Spearman’s ρ rank-correlation coefficient or paired-sample t-test, with '***', '**', and '*' referring to significance at p<0.001, p<0.01, and p<0.05, respectively.

