. 2021 Apr 23;10:e63779. doi: 10.7554/eLife.63779

Figure 1. Planarian stem cell resistance to doses up to 15 Gy of gamma IR requires conserved DDR pathways.

(A) smedwi-1 FISH of planarians exposed to different doses of gamma IR (5, 10, 15, 20, and 30 Gy) after 1 and 3 days post-IR (dpi) showing a dose-dependent decrease in stem cell number. Scale bar: 300 μm. (B) Quantification of smedwi-1+ cells/mm2 (yellow) showing the repopulation kinetics of surviving stem cells after different doses of IR post-IR (n = 5 per dose, per time point). Results are expressed as mean ± SD. (C) COMET assay showing the extent of DNA breaks (comet shape) in isolated planarian cells at 24 hr after exposure to 5, 15, and 30 Gy of IR. (D) Quantification of the percentage of tail DNA in COMET assay post-IR at 24 hr. Results are expressed as mean ± SD. Each dot represents the tail DNA in individual planarian cells. (***p<0.0001, one-way ANOVA using Tukey’s multiple comparison test). (E) Double immunostaining with Anti-TUD-1 (Yellow) and Anti-PAR (Magenta) showing DNA damage in stem cells (Tud-1+) and post-mitotic differentiated cells (Tud-1) at 5 min post 5 Gy IR. Nucleus is stained with Hoechst (blue). (F–G) Quantification of PAR fluorescence in Tud1+ and Tud1 cells normalised to the nuclear area in irradiated and unirradiated cells (0 Gy) (*p<0.0001. Student’s t-test). (H) Representative FISH showing stem cell repopulation in Control (gfp) RNAi and after knockdown of different DNA repair genes (involved in homologous recombination [atr, atm, brca2, fancJ, rad51] and Alt-NHEJ [parp1, parp2, parp3]) after 7 days post 15 Gy IR. Gene name represents the RNAi condition. (I) Repopulation of smedwi-1+ cells/mm2 in DDR RNAi worms after 7 days post 15 Gy IR (n = 5 per condition). Results are expressed as mean ± SD in log10 scale (***p<0.0001, **p<0.001, one-way ANOVA using Tukey’s multiple comparison test).

Figure 1—source data 1. Numerical data used to make Graphs B, D, F, G, and I.

Figure 1.

Figure 1—figure supplement 1. Dynamics of stem cell proliferation and repair kinetics of DNA damage in planarian stem cells.

Figure 1—figure supplement 1.

(A) FISH showing repopulation of smedwi-1+ stem cells after different doses of IR at indicated days post-IR (dpi). Scale bar: 300 μm. (B) Survival curve indicating the percentage of animals alive after exposure to different doses of ionising radiation, n = 15 per dose. Unirradiated and worms exposed up to 15 Gy IR showed 100% survival. (C) Immunostaining with mitotic marker Anti-H3 phosphorylated-ser10 (H3pSer10) showing the repopulation of mitotic cells (yellow) after exposure to different doses of gamma IR (5, 10, 15 Gy) at indicated days post-IR (dpi). Scale: 500 μm. (D) Quantification shows the repopulation kinetics of mitotic cells at different doses of irradiation (n = 5 per condition). Results are expressed as mean ± SD. (E) The presence (green) or absence (red) of conserved DNA repair genes involved during double-stranded break repair (DSB) as sensors and transducers in homologous recombination, single-stranded annealing (SSA), microhomology-mediated end-joining (MMEJ), and non-homologous end-joining (NHEJ), single-stranded break repair in metazoans. The yellow box highlights the DNA repair proteins in S. mediterranea. The phylogenetic tree is based on Grohme et al., 2018.
Figure 1—figure supplement 1—source data 1. Numerical data used to make Graphs B and D.
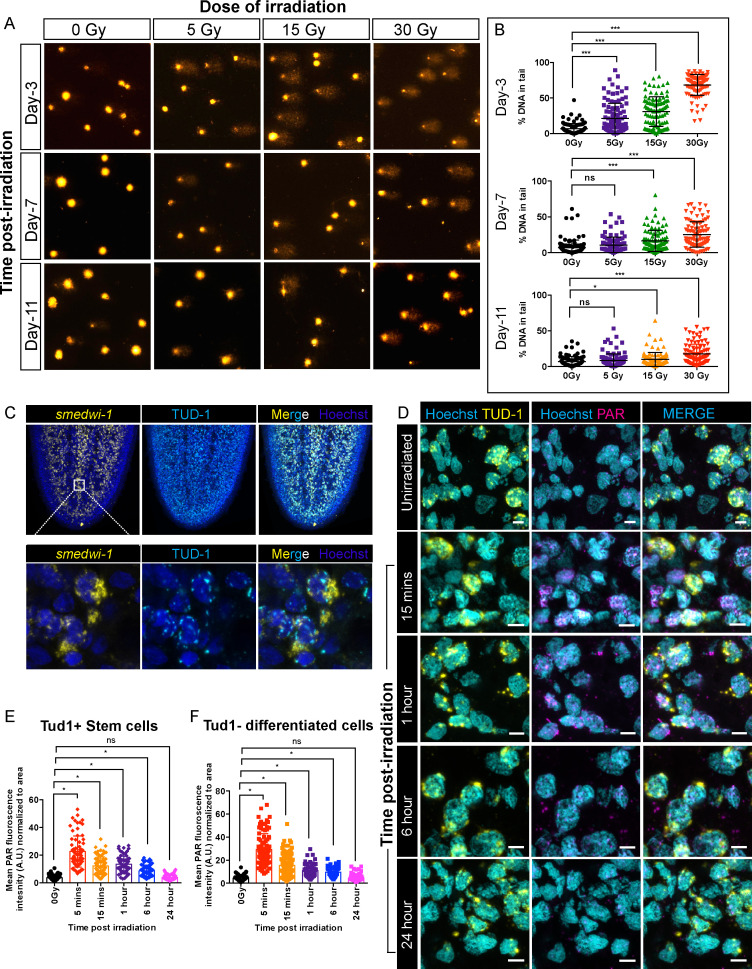
Figure 1—figure supplement 2. Detection of DNA breaks and DNA damage response in planarian cells after irradiation.

Figure 1—figure supplement 2.

(A) COMET assay showing the extent of DNA breaks (Comet-shaped tails) on dissociated planarian cells at 3, 7, and 11 days post-exposure to 5, 15, and 30 Gy of gamma IR. (B) Quantification of the percentage of tail DNA in individual comet at indicated time points and dose of IR. (n = 100 comets per condition/time point) (*p<0.0001, Tukey’s multiple comparison test). (C) Smedwi-1 FISH and Tudor-1 (TUD1) immunostaining showing the presence of perinuclear chromatoid bodies (TUD1+, Cyan) in smedwi-1+ stem cells (Yellow). Nucleus is stained with Hoechst (Blue). (D) Double immunostaining with Anti-TUD1 (yellow) and Anti-Poly ADP Ribose (PAR, magenta) antibodies showing increase in nuclear PAR formation in irradiated planarian cells compared to unirradiated controls; scale bar: 10 µm. (E, F) Quantification of PAR fluorescence normalised to the area of nucleus from individual TUD1+ stem cells (E) and TUD1 differentiated cells (F) at 5 min, 15 min, 1 hr, 6 hr, and 24 hr post-exposure to 5 Gy IR. The nucleus is stained with Hoechst and pseudo-coloured to cyan. The perinuclear TUD1 staining and Hoechst stained nucleus is used to measure the area of individual nuclei. (*p<0.0001, ANOVA using Tukey’s multiple comparison test).
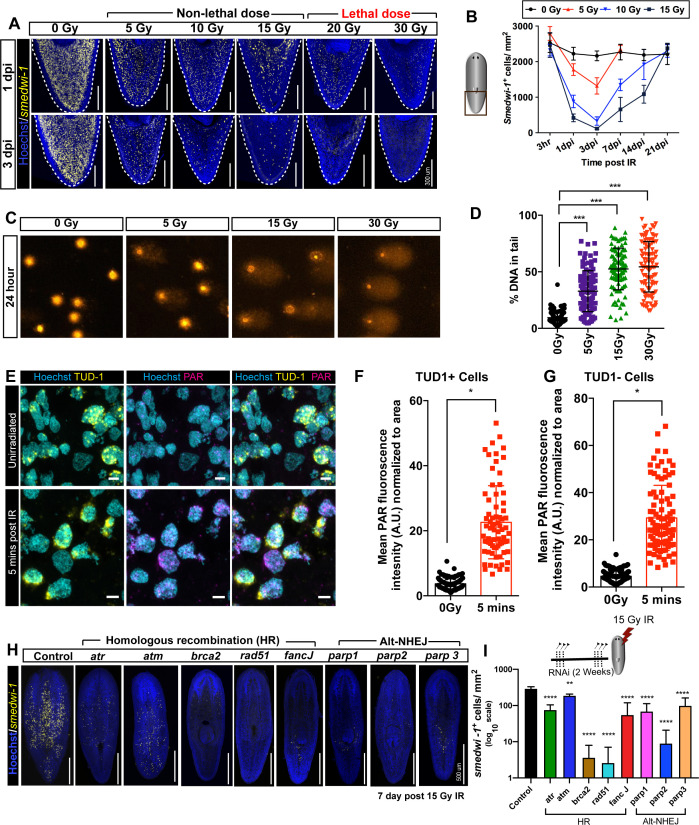
Figure 1—figure supplement 2—source data 1. Numerical data used to make Graphs B, E, and F.
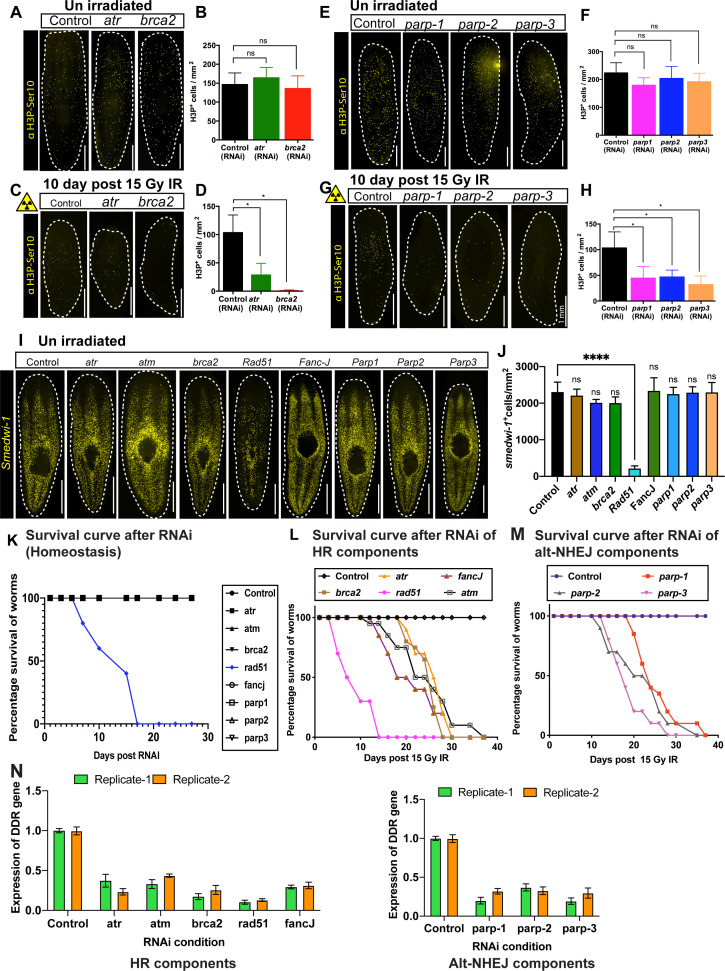
Figure 1—figure supplement 3. Role of DNA repair gene in planarian stem cell maintenance.

Figure 1—figure supplement 3.

(A) Immunostaining with H3pSer10 shows the presence of mitotic cells in control worms and after atr and brca2 RNAi. (B) Quantification of H3P+ cells show no significant difference in cell division after atr and brca2 RNAi. (n = 5 per RNAi). Results are expressed as mean ± SD and (p=0.6442 [atr], p=0.8506 [brca2], ns = not significant, Tukey’s multiple comparison test). (C) Immunostaining with H3pSer10 showing the repopulation of mitotic cells in control worms and after atr and brca2 RNAi worms, 10 days post 15 Gy IR. (D) Quantification of H3p+ cells shows a significant difference in the repopulation of mitotic cells after atr and brca2 RNAi after irradiation, 10 days post 15 Gy IR. (n = 5 per RNAi). Results are expressed as mean ± SD (*p<0.0001, Tukey’s multiple comparison test). (E) Immunostaining with H3pSer10 shows the presence of mitotic cells in control worms and after parp1, parp2, and parp3 RNAi. (F) Quantification of H3p+ cells shows no significant difference in cell division after parp1, parp2 and parp3 RNAi. (n = 5 per RNAi) Results are expressed as mean ± SD and Student’s t-test used for analysis (p=0.2279 [parp1], p=0.8074 [parp2], p=0.5001 [parp3], ns = not significant, Tukey’s multiple comparison test). (G) Immunostaining with H3pSer10 showing the repopulation of mitotic cells in control worms and after parp1, parp2, and parp3 RNAi worms, 10 days post 15 Gy IR. (H) Quantification of H3p+ cells show a significant difference in the repopulation of mitotic cells after parp1, parp2, and parp3 RNAi after irradiation. (n = 5 per RNAi) (*p<0.0001, Tukey’s multiple comparison test). (I) Representative FISH showing stem cell density in Control (gfp) RNAi and after knockdown of different DNA repair genes [involved in homologous recombination (atr, atm, brca2, fancJ, rad51) and Alt-NHEJ (parp1, parp2, parp3)] at unirradiated/homeostatic condition. (J) Quantification of smedwi-1+ cells/mm2 in DDR RNAi worms (n = 3–5 per condition). Results are expressed as mean ± SD (***p<0.0001, ns = not significant, one-way ANOVA using Tukey’s multiple comparison test). (K) Survival curve of DDR RNAi worms showing lethality of Rad51 RNAi worms in homeostatic condition (n = 10 worms per condition). (L, M) Survival curve of DDR RNAi worms after exposed to 15 Gy IR (n = 15 worms per condition). (N) qPCR results showing the efficiency of knockdown of DNA repair genes.
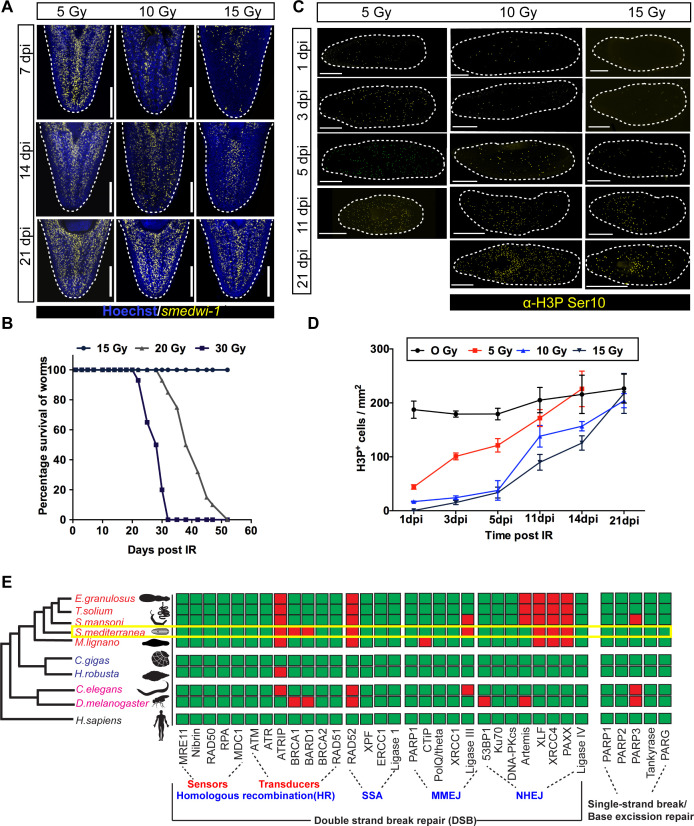
Figure 1—figure supplement 3—source data 1. Numerical data used to make Graphs B, D, F, H, J, K, L, M, and N.