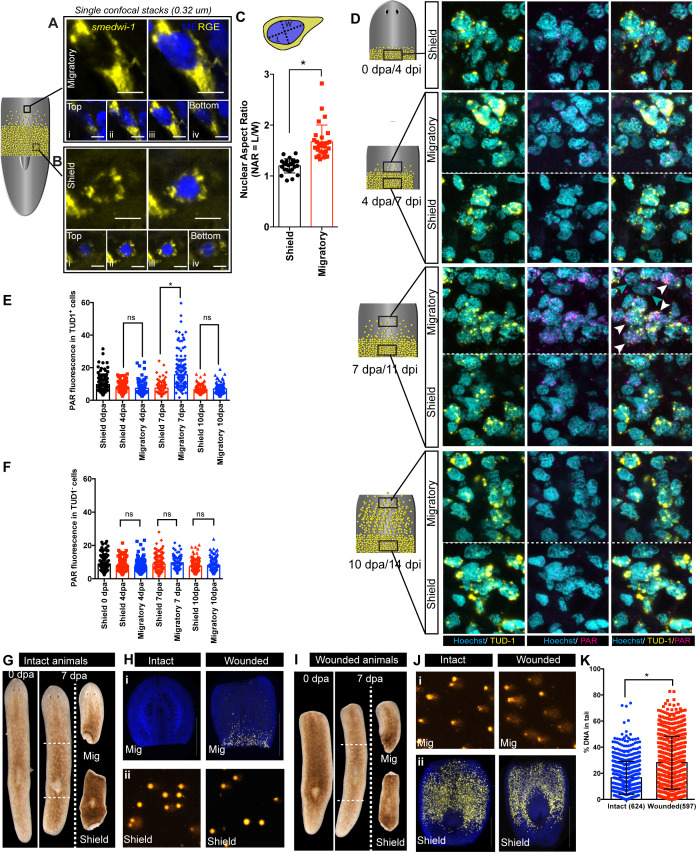
Figure 2. Migration-coupled DNA damage (MCDD) in stem cells.
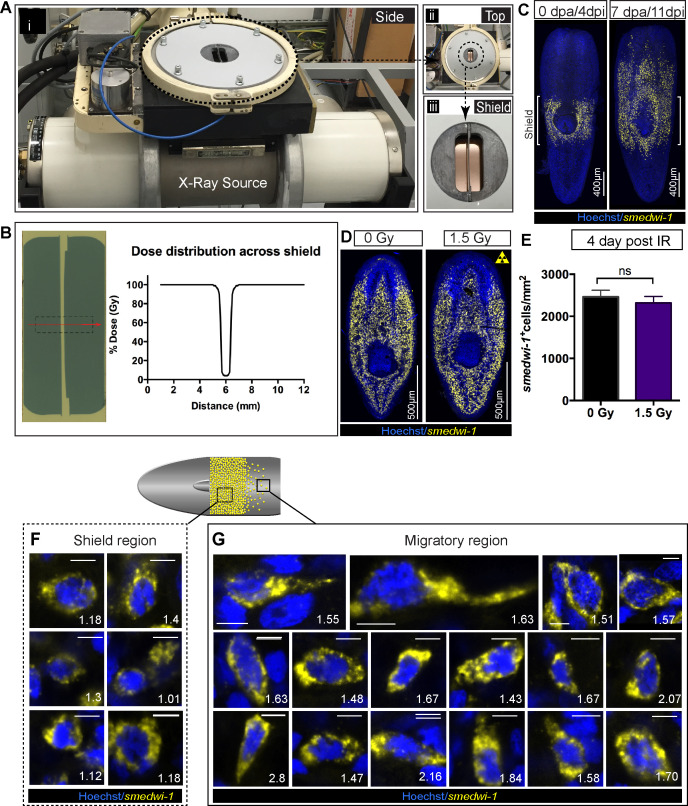
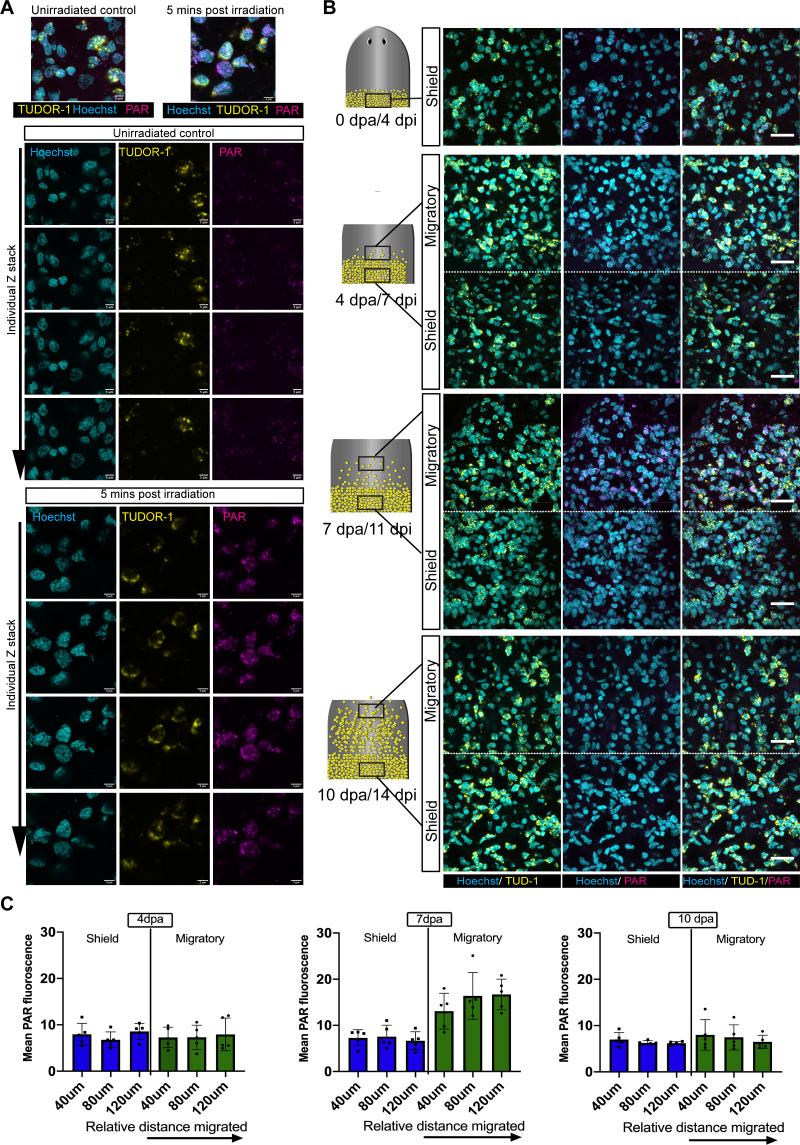
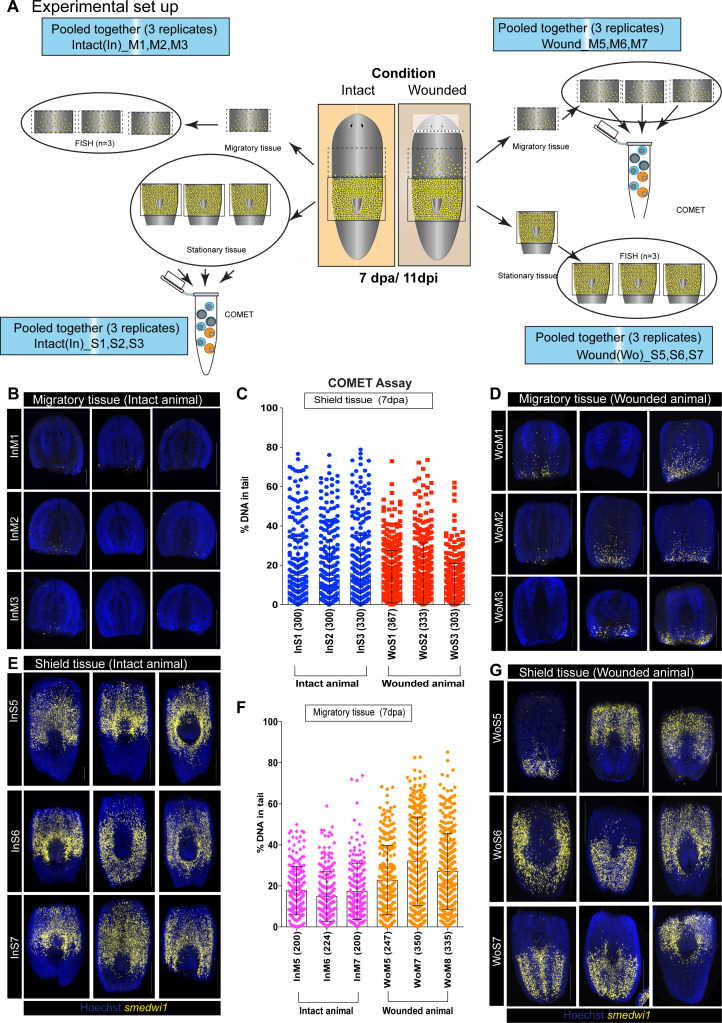
Representative FISH showing stem cells (smedwi-1+) with extended protrusions in migratory cells (A) and stationary cells from the shielded region (B). Nuclei stained with Hoechst (blue). Images are shown as single confocal Z-stack (0.32 μm). (i–iv) is the single Z-stack from top to bottom. Scale bar: 5 μm. The cartoon explains the setup of shielded irradiation assay where a lead shield is placed in the middle and a lethal dose of 30 Gy is given to these worms. Cells under the shield (Yellow) are protected from IR and starts to migrate after amputation. (C) Quantification of nuclear aspect ratio (NAR) in the migratory cells compared to stationary cells (n = 28 cells in migratory region and n = 24 cells from the shield at 7 dpa/11 dpi [shielded irradiation assay]) (*p<0.0001. Student’s t-test). (D) Immunostaining with anti-PAR (magenta) in migrating stem cells (anti-TUD-1, yellow) after 0, 4, 7, and 10 days post-amputation showing MCDD in TUD-1+ migrating stem cells. Box denotes the field of cells imaged for analysis. Nuclei stained with Hoechst (cyan). Scale bar: 5 μm. White arrows denote increased nuclear PAR staining in Tud1+ stem cells at 7 dpa, and gray arrow denotes lack of PAR fluorescence in Tud1− cells. Quantification showing the PAR fluorescence normalised to the nuclear area from Tud1+ stem cells (E) and post-mitotic differentiated Tud1− cells (F) in the migrating region compared to stem cells in the shield. The measurement of PAR fluorescence is strictly nuclear and results are expressed as mean ± SD. (*p<0.0001; one-way ANOVA using Tukey’s multiple comparison test). Brightfield images of intact (G) and wounded (I) animals at 0 dpa and 7 dpa showing the amputated migratory region and shielded region. Dotted lines denote the position of the shield. The migratory region was used for smedwi-1 FISH and the corresponding shielded region was used for COMET assay and vice versa depending on the context (refer to Figure 2—figure supplement 3). (H) smedwi-1 FISH of the migratory tissues at 7 dpa showing the presence of migrating stem cells in wounded animals compared to no migration in intact animals. Cells corresponding to the shielded region were used for COMET assay to check for the extent of DNA damage. (J) smedwi-1 FISH of the shielded tissue at 7 dpa showing the presence of stem cells under the shield in intact and wounded animals. Cells corresponding to the migratory region from the animals were used for COMET assay to check for the extent of DNA damage in migrating stem cells in wounded animals. (K) Quantification of COMET assay showing the extent of DNA breaks in migrating cells in wounded animals compared to intact animals (absence of migrating stem cells). Each dot represents the percentage of tail DNA from single cells after COMET assay (n = 624 cells from intact animals, and 597 cells in wounded animals). Results are expressed as mean ± SD (student’s t-test; *p<0.0001).


