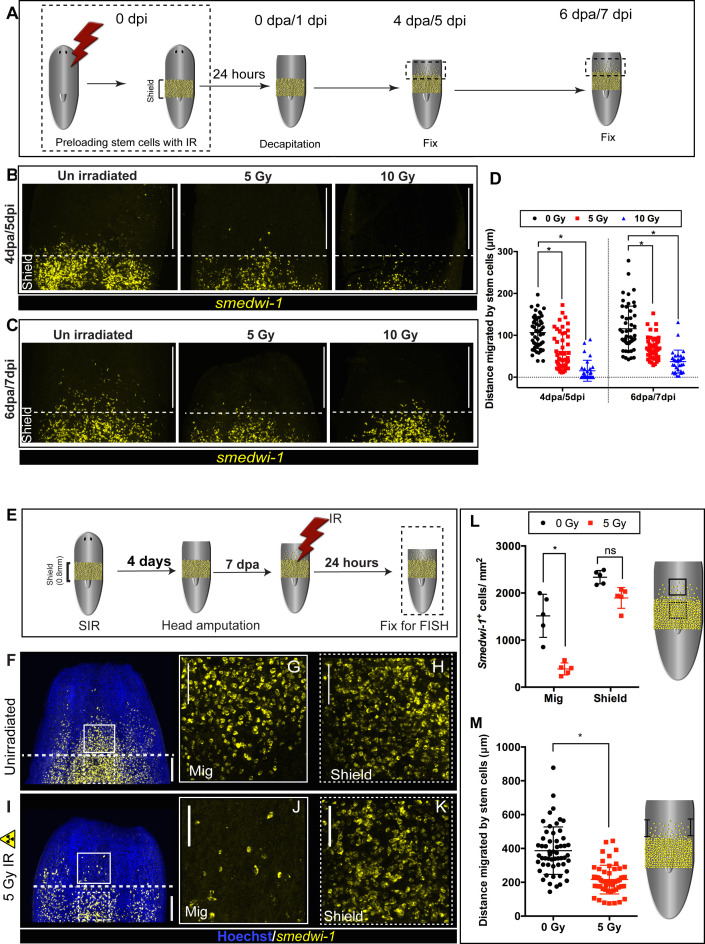
Figure 3. DNA damage delays migration and migrating stem cells with MCDD are more sensitive to ionising radiation.
(A) Experimental scheme showing worms pre-exposed to irradiation (5 and 10 Gy) followed by a shielded irradiation and amputation after 24 hr. Worms are fixed at 4 dpa and 6 dpa (dpa = days post-amputation). Box represents the migratory region, represented in the figure below. (B, C) FISH showing worms pre-exposed to IR (5 and 10 Gy) show delayed stem cell migration after 4 and 6 dpa. Dotted line represents anterior boundary of the shield. Scale bar: 350 μm. (D) Distance migrated by 10 most distant cells are counted from individual worms (n = 5 per condition). Results are expressed as mean ± SD. Statistical significance determined by multiple t-test using the Holm–Sidak method, *p<0.05. (E) Schematic of experimental set up to study sensitivity of migrating cells to IR. In addition to the initial shielded irradiation, the worms were irradiated with a low dose of IR (5 Gy, whole body) when MCDD is high (7 dpa) and are fixed after 24 hr to check the survival of the migratory stem cells to IR. (F–K) Representative smedwi-1 FISH showing migrating cells are more sensitive to IR than the cells in the shielded region. The region counted for analysis is marked with a box (bold: migratory region, dotted: shielded region). (n = 5 per condition, scale bar: 200 μm F, I; ;100 μm G, H, J, K). (L) Quantification of smedwi-1+ cells/mm2 cells in the shielded region and in the migratory region. The decrease in cells/ mm2 in the migratory field is significant compared to the decrease in the shielded region indicating that MCDD sensitises cells to IR. Cartoon showing the region counted for analysis. Each dot represents number of surviving cells from individual worms, n = 5. Statistical significance determined by two-way ANOVA using Tukey’s multiple comparison test (*p<0.05). (M) Distance migrated by stem cells showing that cells are more sensitive to low-dose IR the further they have migrated. Each dot represents the distance migrated by individual cells. Distance migrated by 11 most distant cells are counted from individual worms (n = 5 per condition). Results are expressed as mean ± SD (student’s t-test; *p<0.0001, ns = not significant).


