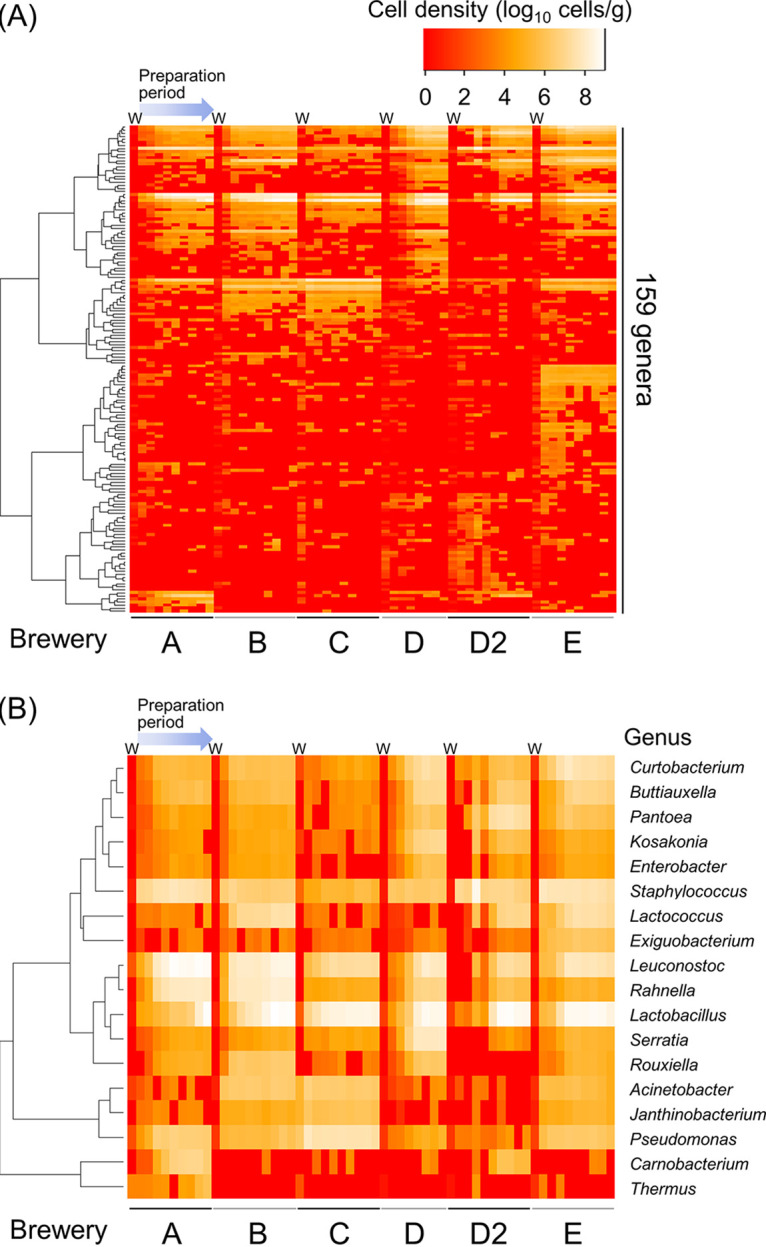
FIG 3.

Changes in bacterial cell density during the seed mash preparation process. Columns with a W at the top show the results of quantifying the cell density of the brewing water. (A) Genera in which the cell density was 100 cells/g or above at more than two sampling points in each batch. (B) Genera in which the cell density was 106 cells/g or above during the preparation process in any one or more sake breweries.
