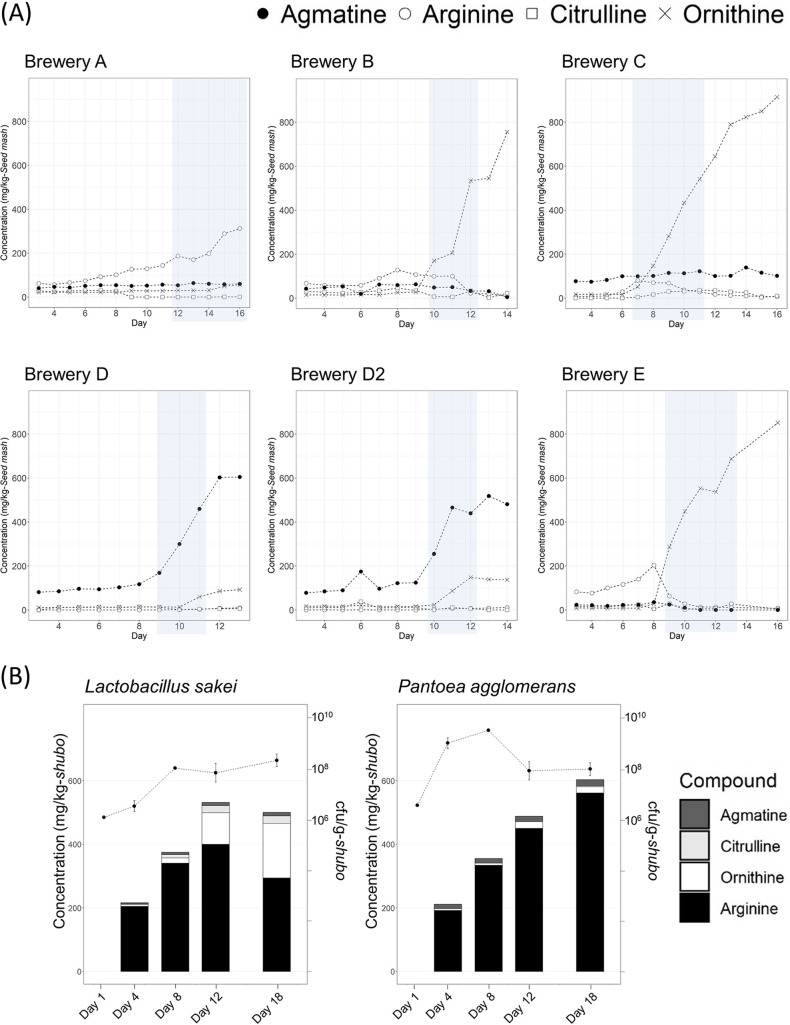
FIG 6.
(A) Temporal changes of concentrations of arginine and arginine-related metabolites in each sake brewery. In the periods shaded gray, we tried to identify the bacterium that was responsible for metabolizing arginine. (B) Temporal changes in the concentrations of arginine and arginine-related metabolites and in the cell density of Lactobacillus sakei or Pantoea agglomerans in small-scale seed mash preparation. The y axis on the left side indicates the concentration of arginine or arginine-related metabolites, and the y axis on the right side indicates the cell density of each bacterium.

