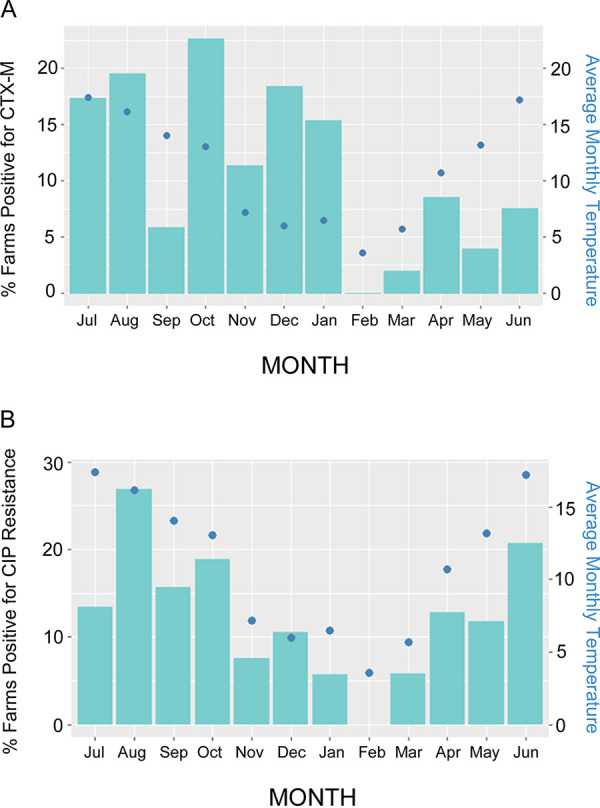
FIG 2.

Percentage of farms with E. coli positive for blaCTX-M in samples (A) or ciprofloxacin-resistant E. coli (B). Data are presented by month (bars) and overlaid by a graph of average monthly temperature (dots) representing a year during the middle period of this study. Samples from calves have been excluded.
