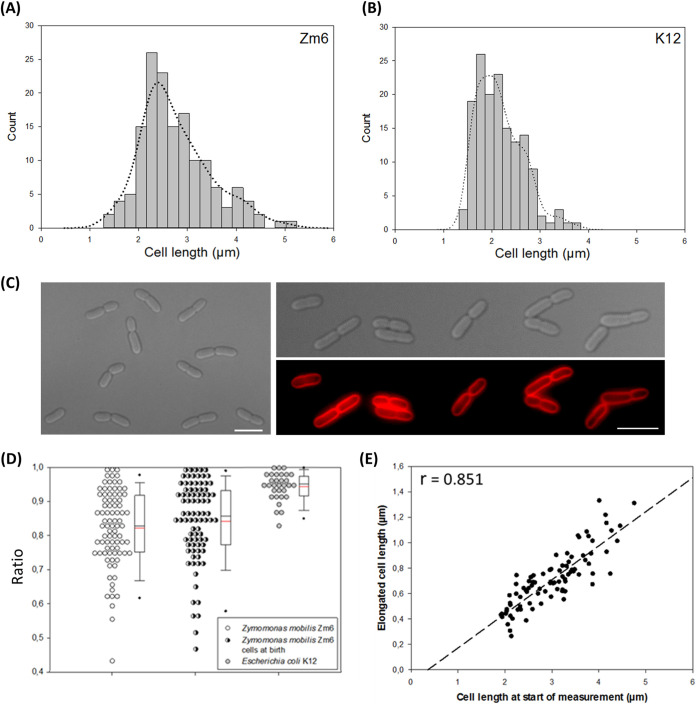
FIG 1.
Cell size, morphology, and single-cell growth profile of Z. mobilis strain Zm6. (A and B) Histogram of cell length in growing Z. mobilis strain Zm6 (OD600 = 0.44; n = 150) and growing E. coli strain K-12 MG1655 (OD600 = 0.7; n = 150). The Zm6 cell population exhibited a wider range of cell lengths than K-12 cells. Estimated kernel density was plotted by a bandwidth of 0.25 for both histograms. (C) Phase-contrast images of growing Zm6 cells (left and right top) and fluorescence image of Zm6 stained with the membrane dye FM4-64 (right bottom). Zm6 was grown in the complex medium (OD600 = 1) under anaerobic conditions, stained with FM4-64 (20 μg/ml) for 15 min, and subsequently washed with PBS before being mounted on an agarose pad for imaging. Note that attached daughter cells often showed different cell lengths. Red, Fm4-64. Bar, 5 μm. (D) Dot density plot of cell length ratio between attached paired cells (length of short cell to length of long cell). Data for Zm6 pairs at a random cell cycle stage (n = 85) (left plot), Zm6 pairs at birth (n = 87) (middle plot), and K-12 pairs at random cell cycle stage (n = 31) (right plot) are shown. Box-and-whisker plots are marked with means (red) and medians (blue). (E) Plot of elongated-cell length during 40 min of growth by a function of cell length at the start of measurement. r, Pearson's correlation coefficient. P < 0.001. n = 88.

