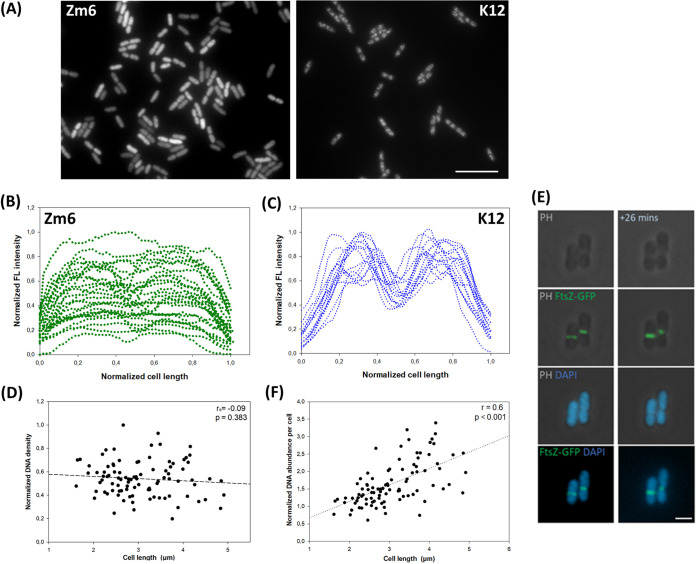
FIG 5.
Analysis of stained nucleoids in Z. mobilis cells. (A) Fluorescence images of DNA staining in growing cells of Z. mobilis strain Zm6 (left) and E. coli strain K-12 (right). Zm6 cells were stained with Syto 9 at 0.55 μM for 10 min. K-12 cells were stained with 5 μg/ml DAPI for 15 min. Both fluorescence signals are white in the images. Note that FL signal intensities varied between Z. mobilis cells. Bar, 10 μm. (B) FL signal profiling of 30 Zm6 cells (n = 30) over the long axis of each cell. FL signal and cell length were normalized. Profiles show that the intensity varied between Zm6 cells. (C) FL signal profiling of K-12 cells (n = 15) over the long axis of each cell. FL signal and cell length were normalized. K-12 cells exhibited similar FL profiles. (D) Plot of normalized average of FL intensity within Zm6 cells, as a function of cell length. There is no correlation between the two factors (Spearman's rank correlation test; P = 0.589, n = 96). (E) Newly dividing Z6KF2 cells labeled with DAPI. Panels (top to bottom) show phase-contrast images, overlays of phase-contrast and fluorescence images (green), overlays of phase-contrast and fluorescence images (blue), and overlays of two fluorescence images (green and blue). Right images were taken 26 min after left images. Green, FtsZ-GFP; blue, DAPI. Bar, 2 μm. (F) Plot of normalized DNA abundance per cell compartment by the cell length of Zm6 cells. A positive correlation (Pearson's r = 0.6) was found. n = 96.

