
FIG 2.
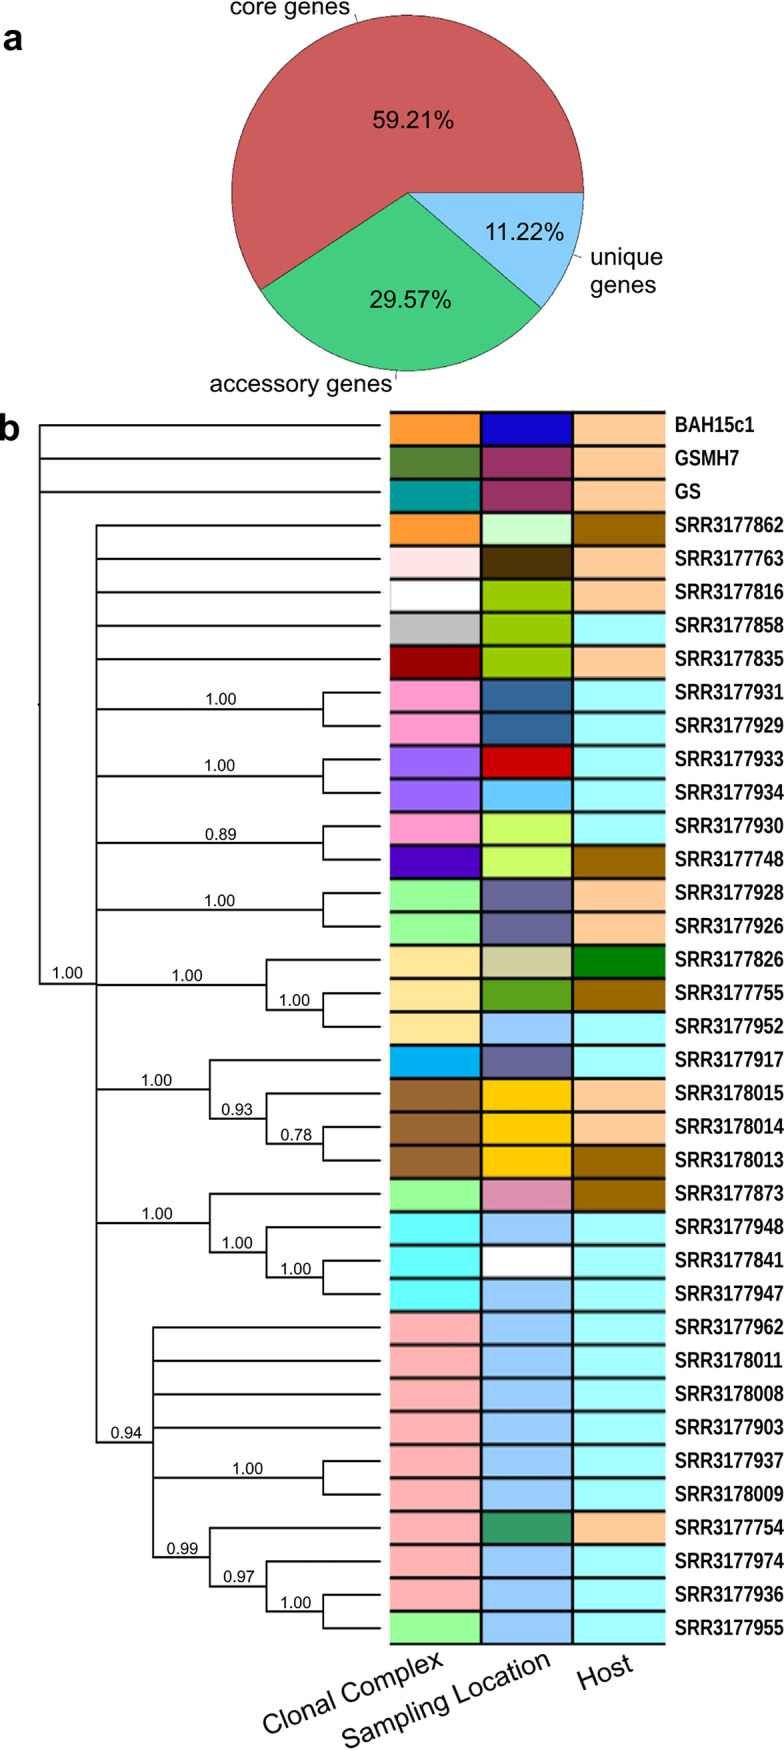
Evaluation of the pangenome of assemblage B. (a) Pie chart of genes classified into one of three categories: (i) core genes present in all genomes, (ii) accessory genes, missing from at least one genome, and (iii) unique genes, found in only one genome. (b) Neighbor-joining tree of pairwise distances calculated from the presence-absence matrix in panel a. The tree shows relationships between genomes based on shared gene content. Colored bars to the right of the tree highlight shared metadata (assignment to 1 of the 16 clonal complexes, sampling location, and host) between genomes.