
FIG 5.
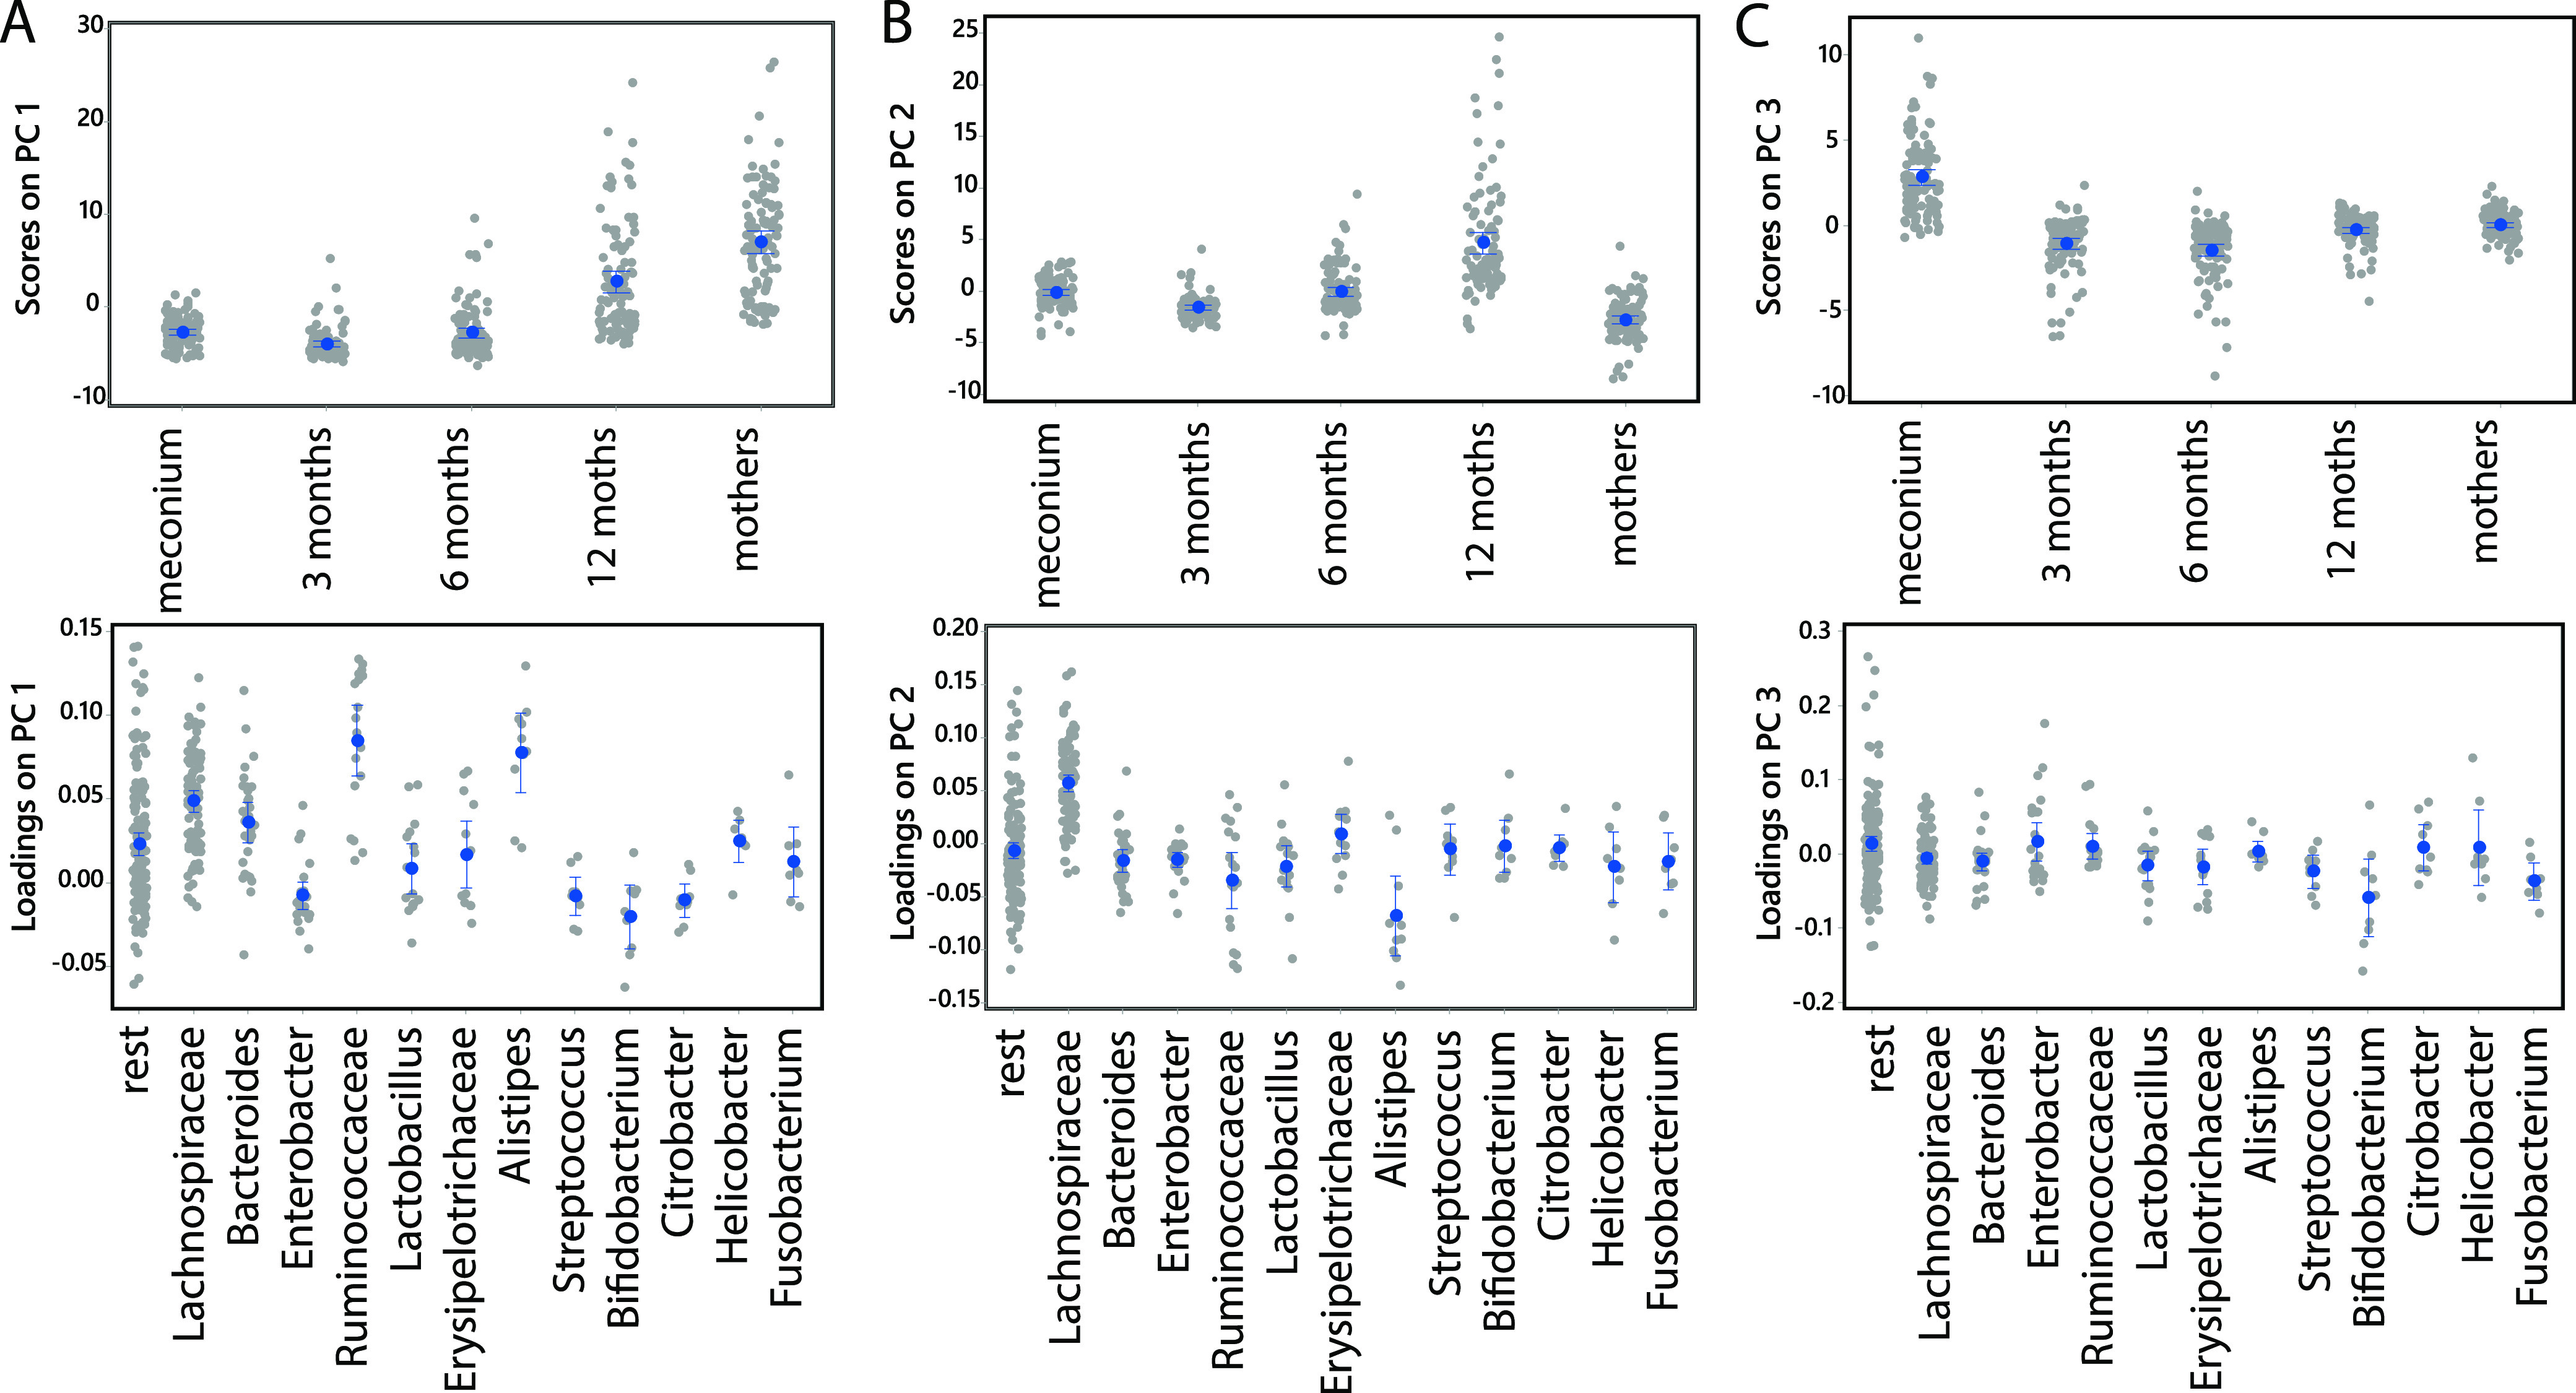
Association between age groups and microbiota. The association between age groups and microbiota was determined by ASCA-ANOVA analyses for the first three principal components. (A to C) The first principal component (A) explained 64.8% of the variance, the second component (B) explained 23.8% of the variance, and the third component (C) explained 8.4% of the variance. The top panels represent the scores of the samples, while the bottom panels represent the loading (importance) of the different taxonomic groups.