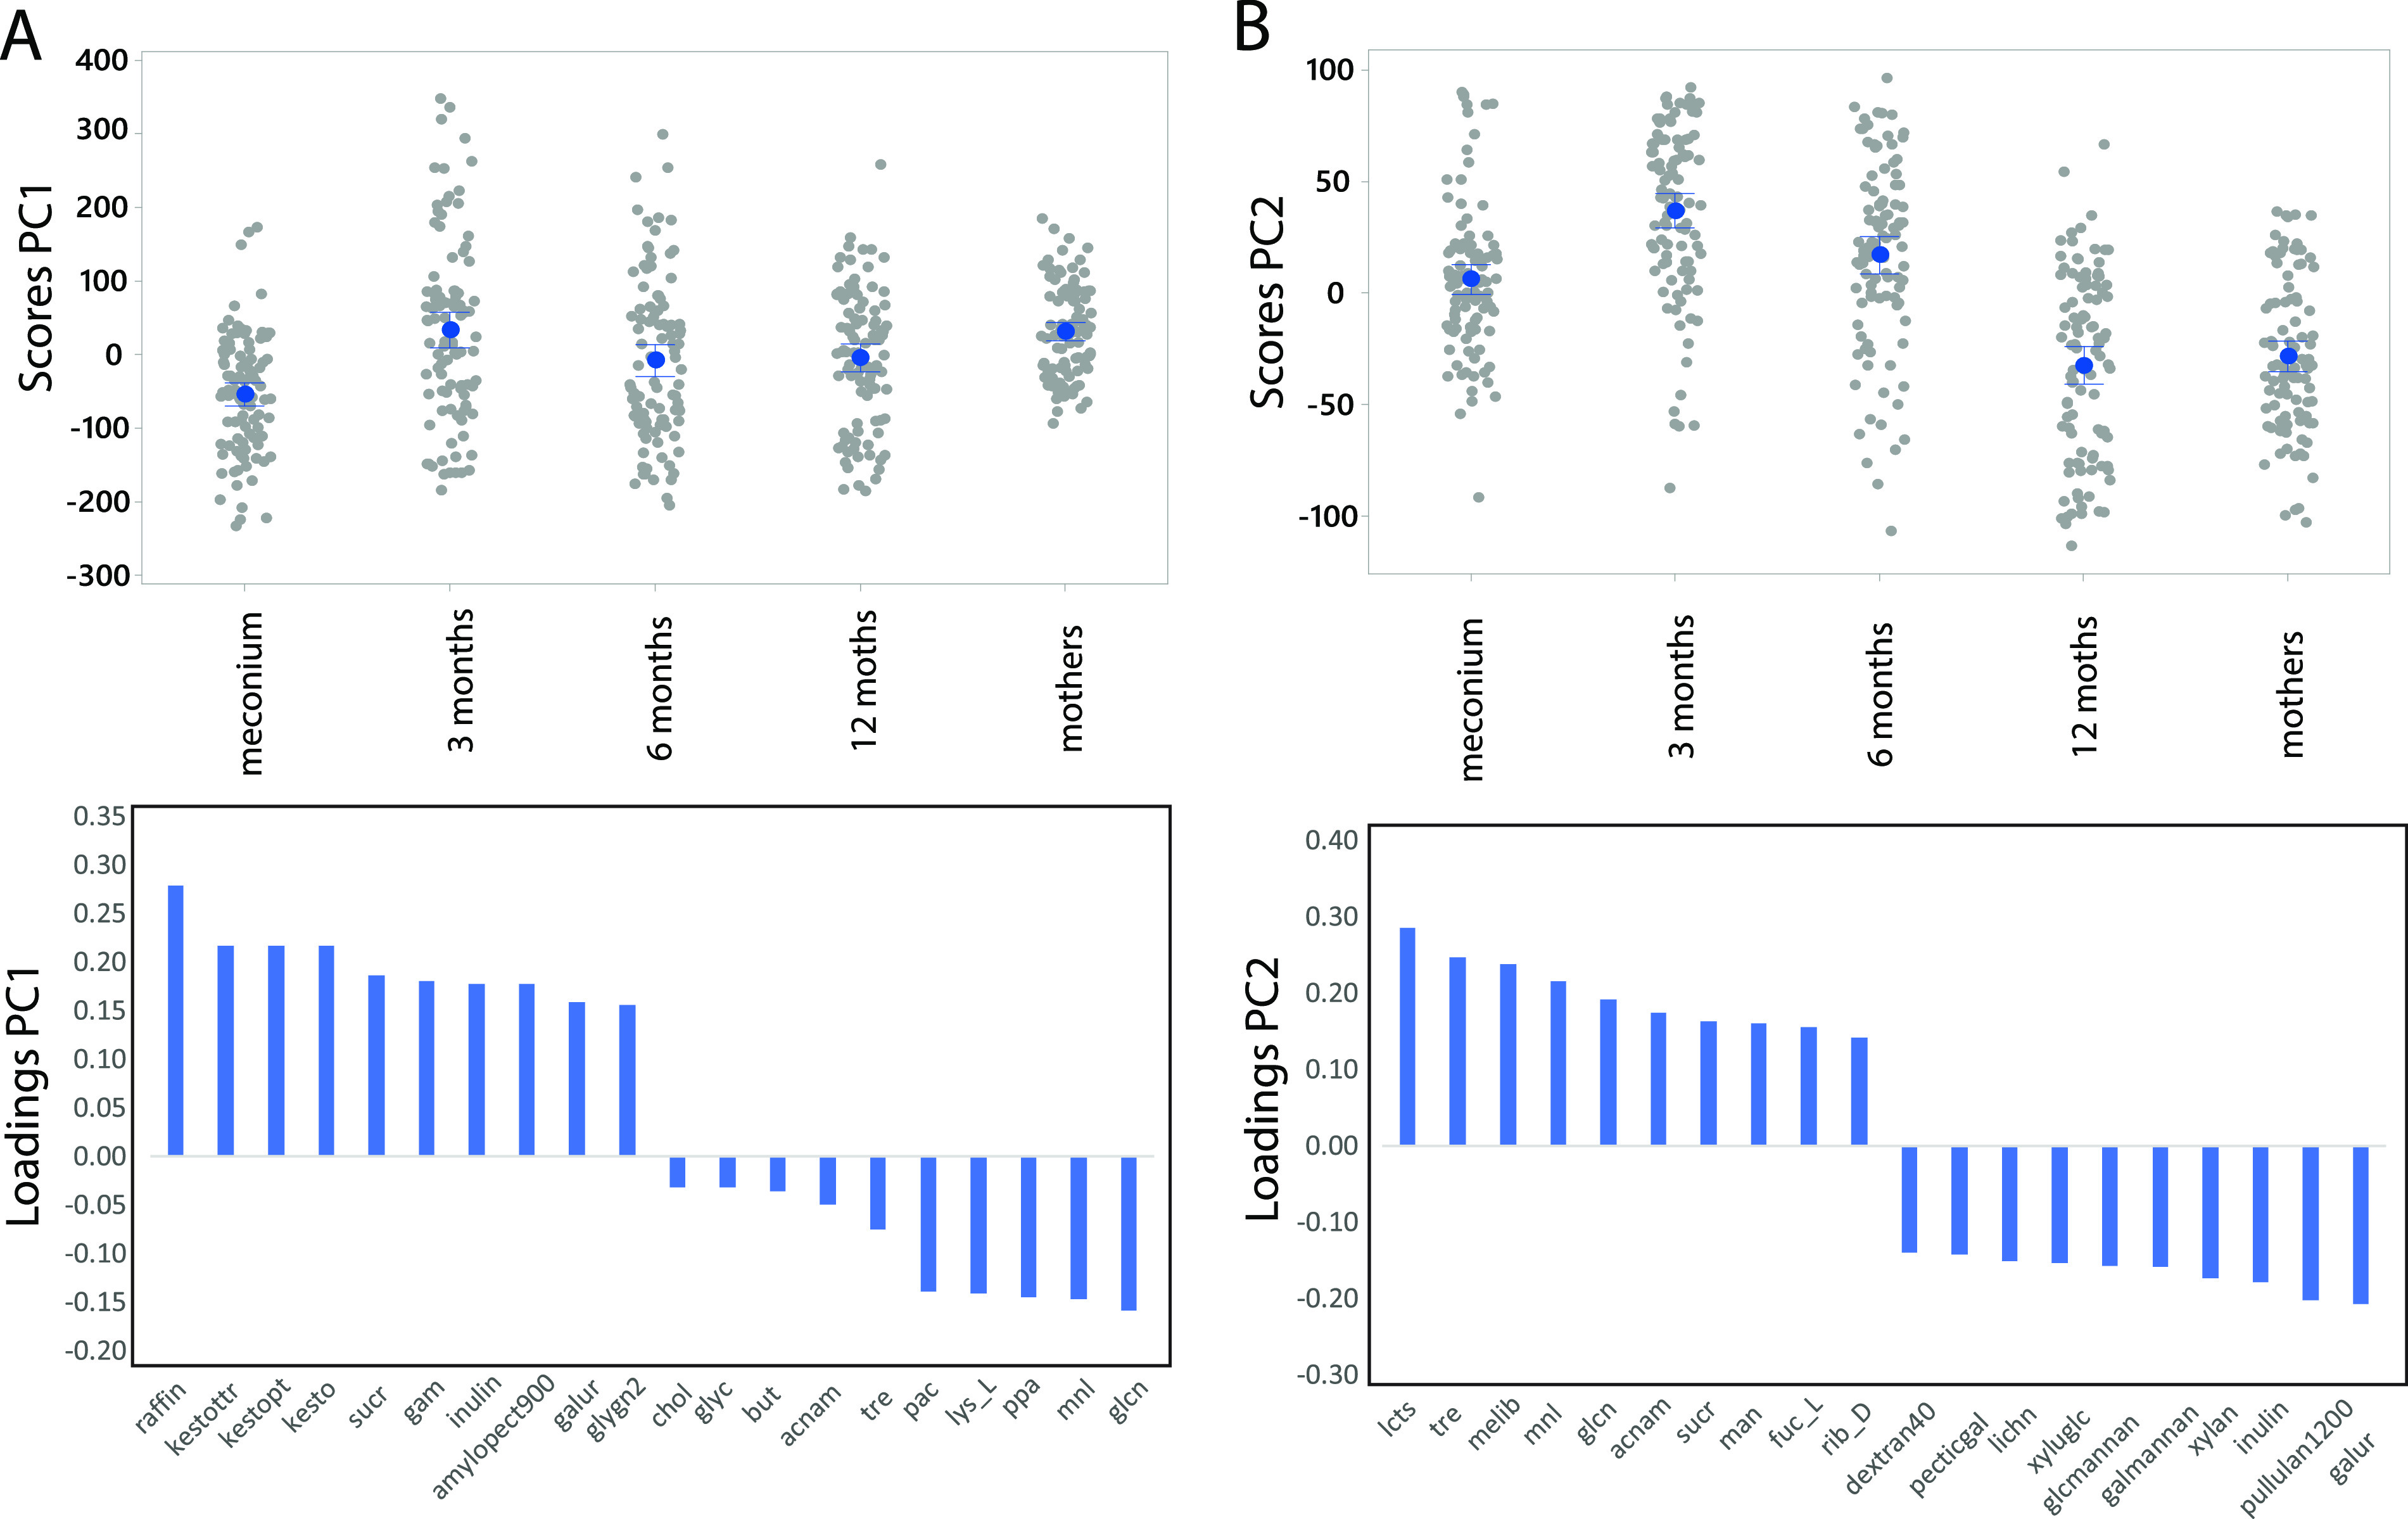
FIG 6.

Association between age groups and carbon sources. The association between age groups and microbiota was determined by ASCA-ANOVA. Results from the two first principal components are shown in panels A and B, respectively. For both components, the top panels represent the score of the samples while the lower panels represent the loading (importance) of the different taxonomic groups for the 10 variables with the highest and the lowest loadings. Abbreviations are defined in Table S2.
