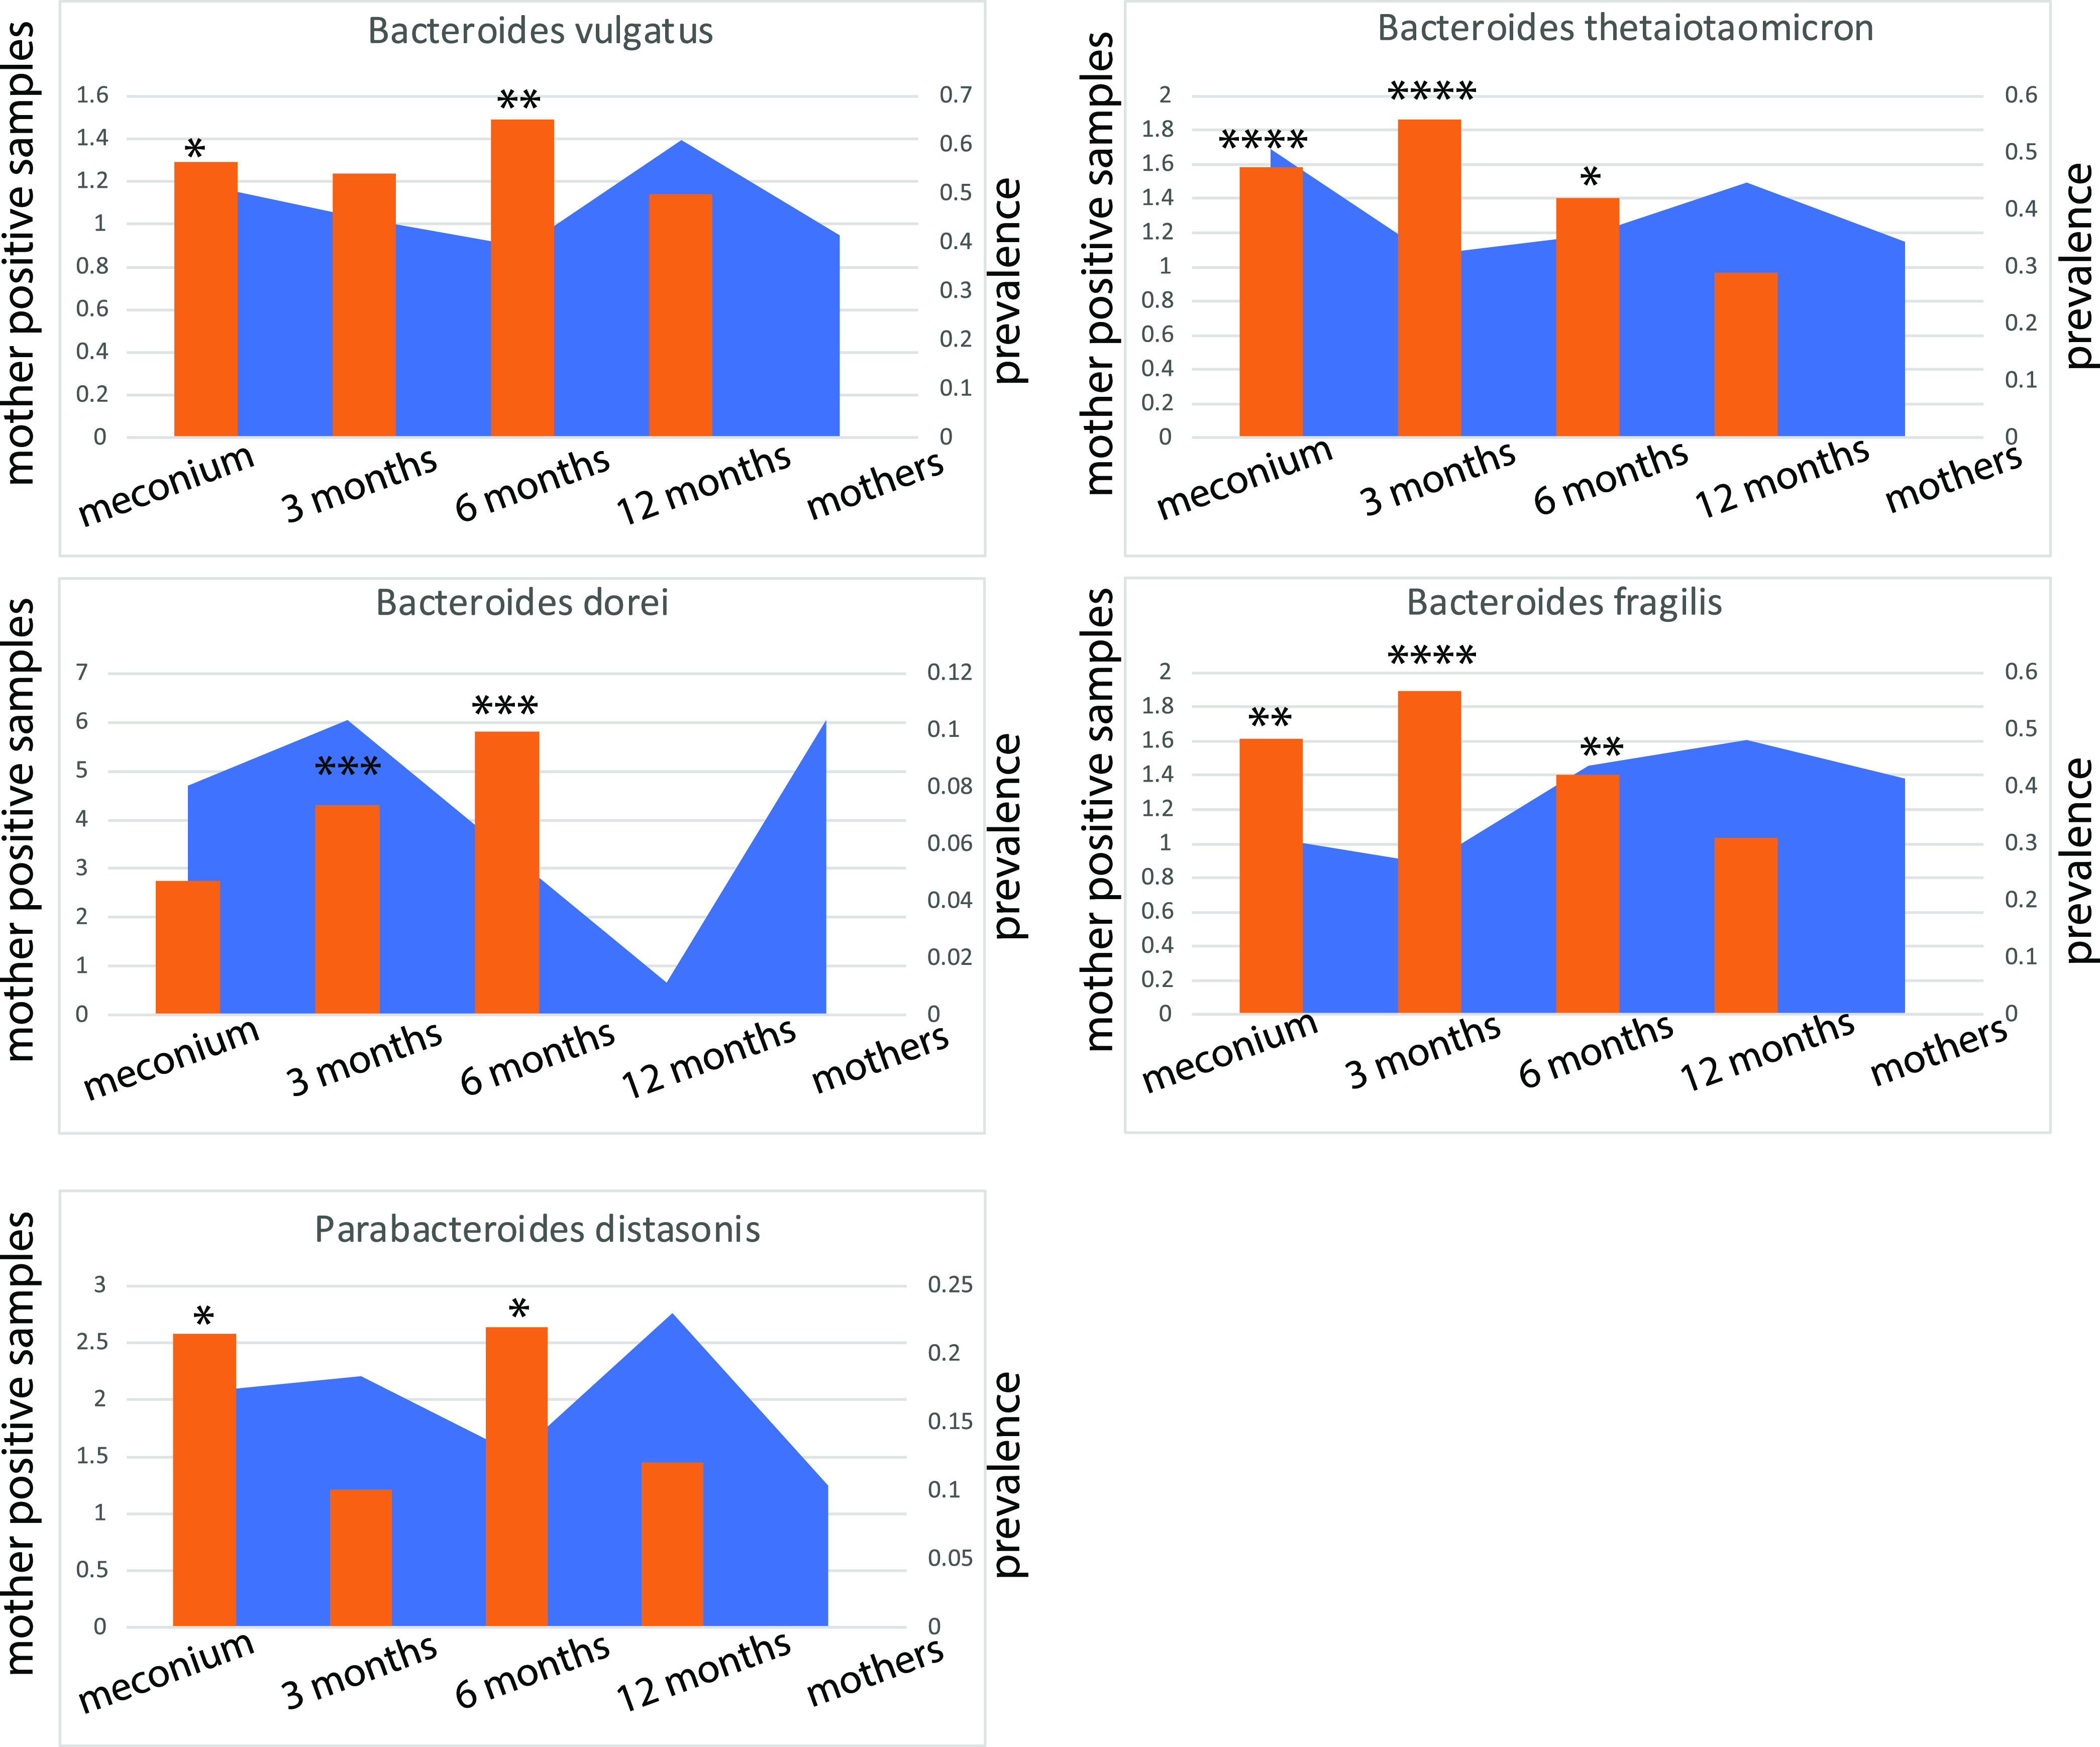
FIG 7.

Mother-child-associated bacteria. Orange bars represent the prevalence in infants whose mothers have positive samples divided by the total prevalence across all mother-child pairs for each age group. The blue graph represents the overall prevalence for each age group. Asterisks represent significance levels for chi-square tests; *, P < 0.05; **, P < 0.01; ***, P < 0.001; ***, P < 0.0001.
