
FIG 3.
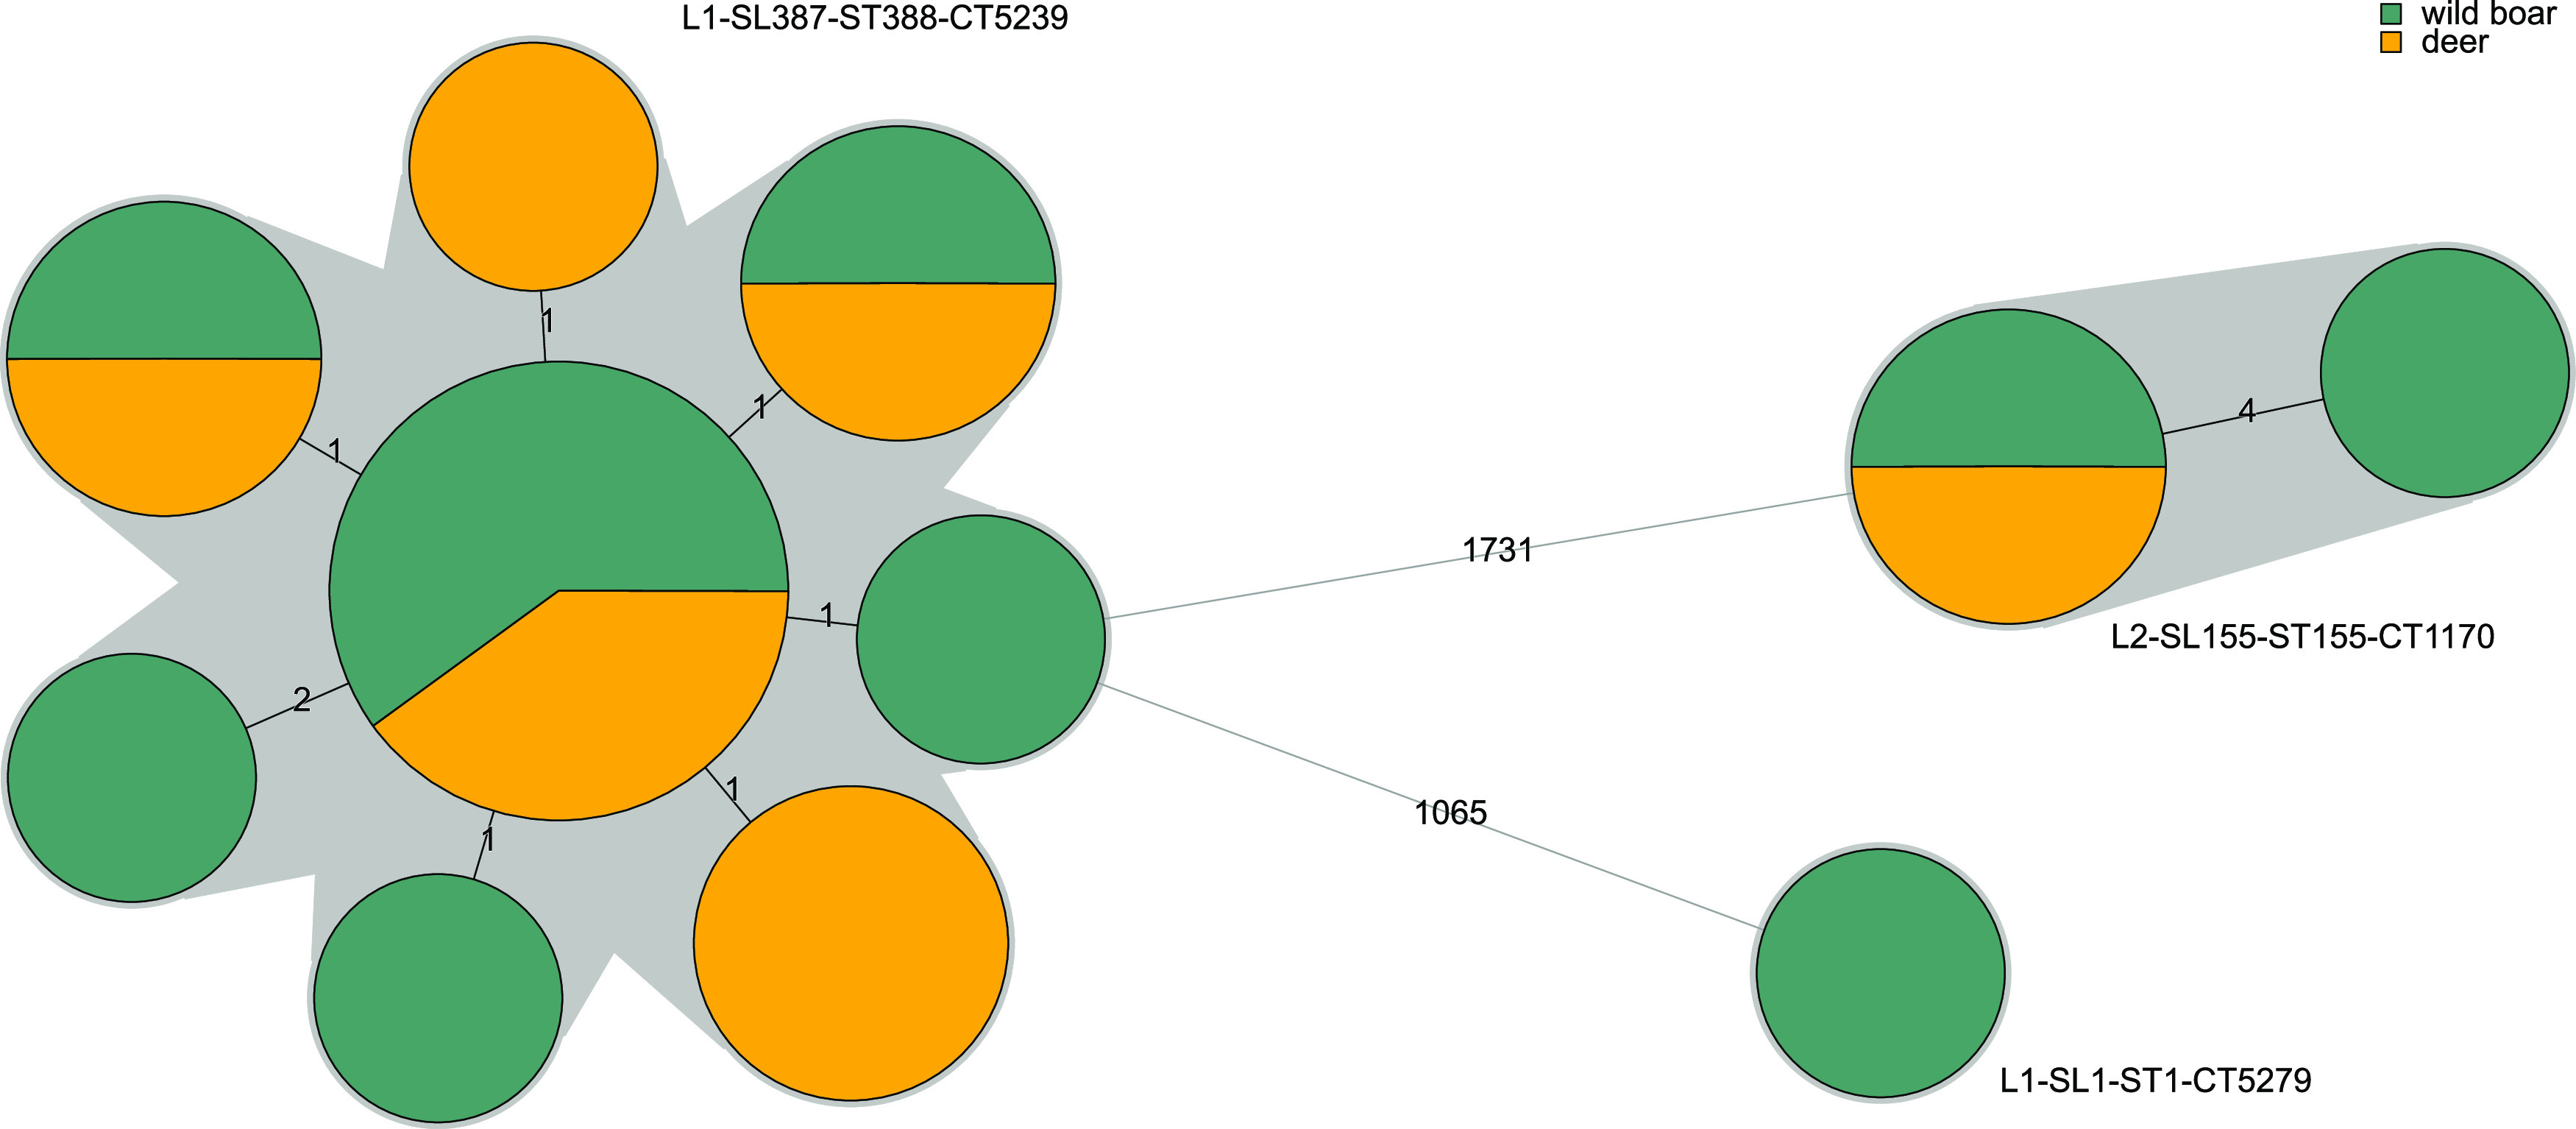
Minimum spanning tree based on the 1,748-locus cgMLST profiles of the L. monocytogenes isolates collected in this study (n = 19). Profiles are represented by colored circles, where size is proportional to the number of isolates and gray zones denote profiles belonging to the same cgMLST type. The number of allelic differences between profiles is indicated on the branches.