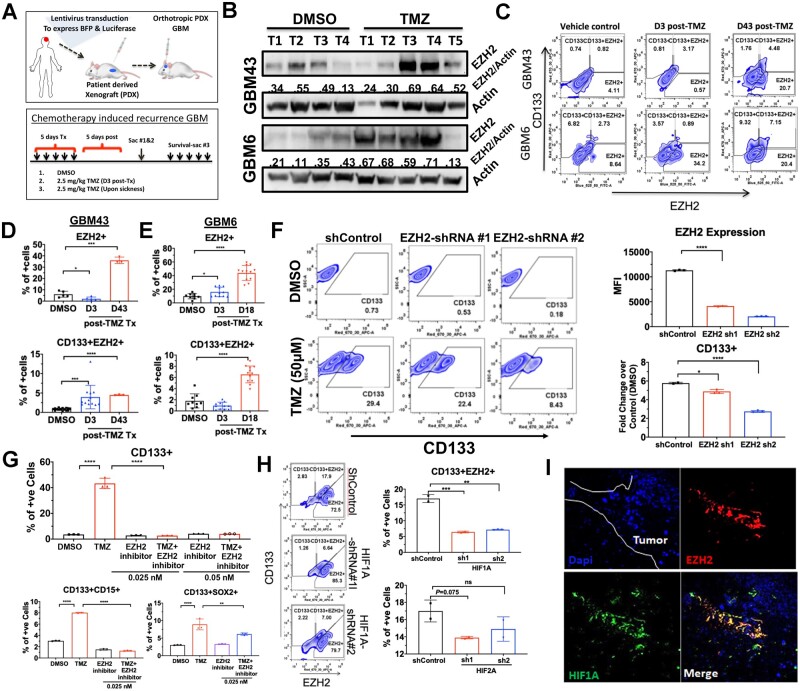
Figure 1.
EZH2 expression is increased in the CSC compartment during TMZ-based chemotherapy. (A) Schematic showing establishment of a blue fluorescent protein (BFP) and luciferase expressing PDX line as well as the treatment regimen (left) for establishment of recurrent tumours. PDXs were established for 7 days and treated with TMZ (2.5 mg/kg). Animals were sacrificed and analysed by FACS during therapy (Day 3) and after recurrent (Days 17–18 for GBM6 and Days 43–44 for GBM43). (B) Western blot analysis on tumour tissue isolated from in vivo intracranial PDX tumour treated with DMSO or TMZ during therapy. Numbers are relative pixel intensity of EZH2 bands normalized to actin (n = 4–5). (C) Representative FACS plots for intracranial PDX tumour analysed by FACS with HLA staining for human cells, CSC marker CD133, and EZH2 during therapy (Day 3: D3) and in recurrence (Day 43: D43). (D) Bar graphs displaying per cent of cells staining for either EZH2 alone or EZH2+CD133+ double-positive cells in DMSO (vehicle control) and post TMZ (2.5 mg/kg) at Days 3 and 43 for GBM43 (n = 3). (E) Same as before but post TMZ recurrent at Day 17 for GBM6 (n = 3). (F) Representative FACS plots from GBM6 transduced with lenti-vectors carrying scramble control (shControl) and two different shRNAs for EZH2. Top bar graph represents the EZH2 knockdown efficiency analysed by FACS and represented by mean florescent intensity. Bottom bar graph representing per cent of cells residing in CD133+ gate quantified by fold change over DMSO condition when treated with EZH2 shRNAs. (G) Bar graph representing FACS data displaying per cent of cells showing CD133+, CD133 and CD15+, or CD133 and SOX2+ double-positive, GBM43 PDX cells treated with DMSO, TMZ (2.5 mg/kg), EZH2 inhibitor 3-DZnep (0.05 nM), or combination in vivo flank model as EZH2 inhibitor did not cross the blood–brain barrier. (H) Representative FACS analysis plots and bar graph displaying CD133 and EZH2 staining across shControl and HIF1A or HIF2A knockdown with two shRNAs in GBM43. Numbers represent per cent of cells residing within specific gate. Bar graphs represent FACS data showing per cent of cells expressing both CD133 and EZH2 across the shRNA treatment with either HIF1A or HIF2A knockdown using multiple shRNA. (I) Representative images from orthotopic PDX tumour GBM43 stained for HIF1A and EZH2. All error bars in graphs depict three technical FACS replicates for each animal, each analysis is validated in at least three different animals and represent mean ± standard deviation (SD). *P < 0.05 ***P < 0.001.

