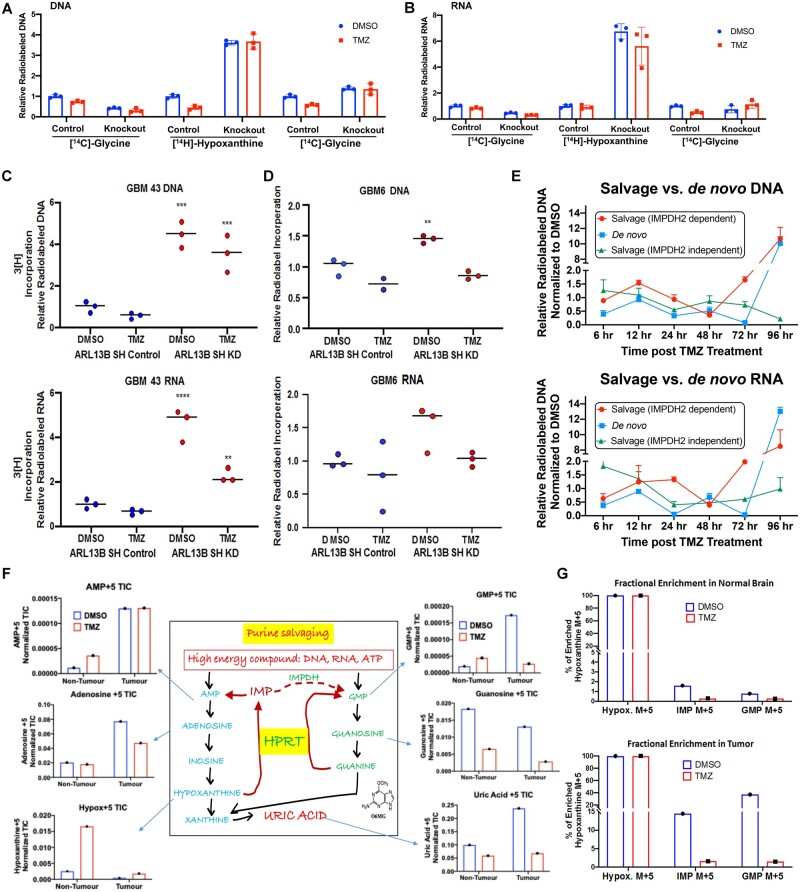
Figure 5.
ARL13B and IMPDH2 interaction functions as a negative regulator of purine salvaging and TMZ therapy alters purine biosynthesis pathways. (A) Radiolabelled tracing of the three major biosynthetic pathways measured by the corresponding radiolabelled metabolite incorporation at the DNA level with or without ARL13B, in the absence and presence of TMZ (50 µM for 48 h) in U251 cells where ARL13B is knocked out with CRISPR-Cas9. Graph depicts relative incorporation of specific radiolabel normalized to control DMSO condition. (B) Same experiments as described before but measuring incorporation in RNA. (C) Radiolabelled tracing of ARL13B knockdown GBM43 PDX treated with TMZ (50 µM) for 48 h. Graph depicts relative 3H incorporation in the DNA across cells with and without ARL13B during TMZ therapy in GBM43. (D) Radiolabelled tracing of ARL13B knockdown GBM6 PDX as described before. (E) Radiolabelled tracing of different purine biosynthesis pathways after 6, 12, 24, 48, 72 and 96 h post TMZ (50 µM) exposure in GBM43. Data presented as normalized to DMSO incorporation from matched time point. (F) Mice bearing GBM43 PDX tumours were infused with labelled hypoxanthine (13C5) for 2 h through systemic tail vein injection. Tissues were collected from intracranial tumour, contralateral normal brain, and subject to analysis by LC-MS. Bar graphs represent in vivo tracing of metabolites from mice bearing a GBM43 PDX tumour. All counts are represented as normalized total ion counts (TIC) and were isolated from tumour or non-tumour tissue ± TMZ. (G) Fractional enrichment for hypoxanthine, IMP, and GMP represented as a bar graphs measured from samples of normal brain tissue. Data measured in per cent enrichment of the mass (M) +5 due to detected m/z shift because of five C13’s in labelled hypoxanthine used. (H) Fractional enrichment in tumour tissue for the experiment described above. Enrichment was calculated from protein-normalized total ion counts and normalized to 13C hypoxanthine incorporation. All error bars in experiments represent technical replicates and display mean ± SD. **P < 0.01 ***P< 0.001 ****P < 0.0001.

