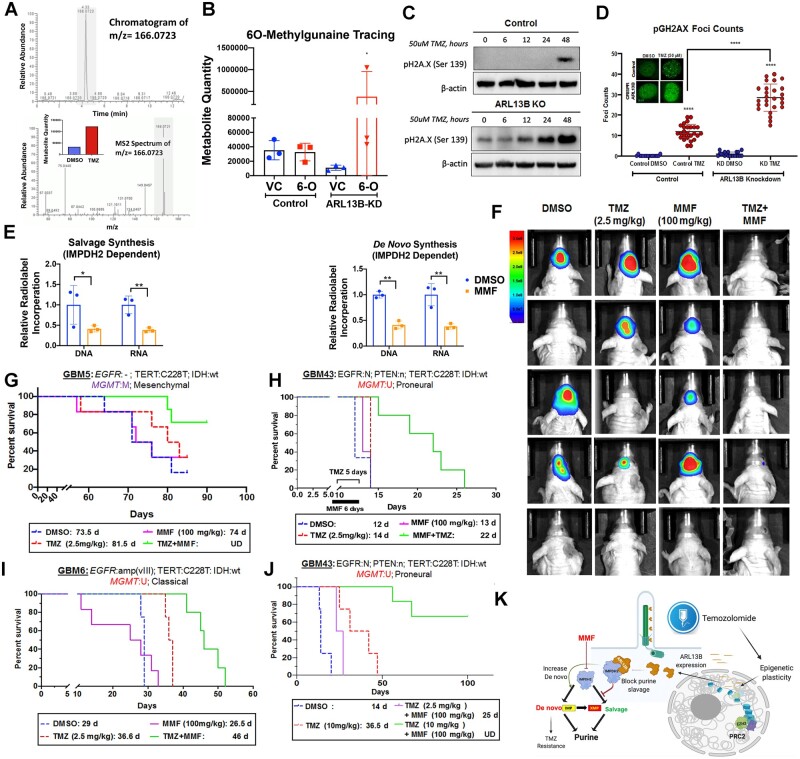
Figure 6.
IMPDH2 inhibitor MMF increases PDX GBM sensitivity towards TMZ in vivo. (A) Chromatograms depicting peak enrichment for O6-methylguanine (O6-MG) marks in GBM (U251) cell DNA by mass spectroscopy. Graph inset demonstrates ion count of O6-MG in cells treated with either DMSO or TMZ for 48 h. (B) Graph depicting O6-MG detection in samples with and without ARL13B exposed to vehicle control (VC) or O6-MG (6-O). Counts are represented as ion count with technical triplicates. (C) Western blots analysis on cells with or without ARL13B treated with TMZ for 0, 6, 12, 24 and 48 h and stained with pH2A.X to evaluate the extend of DNA damage. (D) pH2A.X foci counting in cells with and without ARL13B and treated with either DMSO or TMZ (n = 35). (E) Radiolabelled tracing of IMPDH2-dependent salvage, de novo, and IMPDH2-independent salvage synthesis in GBM43 exposed to DMSO control or MMF (5 µM). DNA and RNA relative incorporations are shown from two biological replicates. (F) Bioluminescence (BLI) measurement of engrafted tumour burden from the mesenchymal GBM5 line followed weekly after receiving DMSO, 2.5 mg/kg TMZ for 5 days, 100 mg/kg MMF for 6 days, or TMZ and MMF combination (n = 6). To address sex as a biological variable we used male and female mice equally. (G) Kaplan-Meier curves showing survival of mice implanted with mesenchymal subtypes of PDX GBM5 treated with DMSO, 2.5 mg/kg TMZ for 5 days, 100 mg/kg MMF for 6 days, or TMZ and MMF combination. Animals were monitored for end point survival. (H) Same experiments as above but with proneural subtype GBM43, and (I) classical subtype GBM6. (J) Kaplan-Meier curve of mice with GBM43 PDX tumour treated with 10 mg/kg TMZ in combination with 100 mg/kg MMF along with above controls. (K) The overall mechanism of therapy induced cellular plasticity can promote expression of ciliary protein ARL13B. ARL13B can interact with IMPDH2 to block purine salvaging and contributes to TMZ-based chemotherapy adaptation. Bar graph and images show biological replicates. Image from Week 3 shown. All error bars represent technical experimental replicates unless noted otherwise and display mean ± SD. *P < 0.05 ** P < 0.01 ****P < 0.0001.

