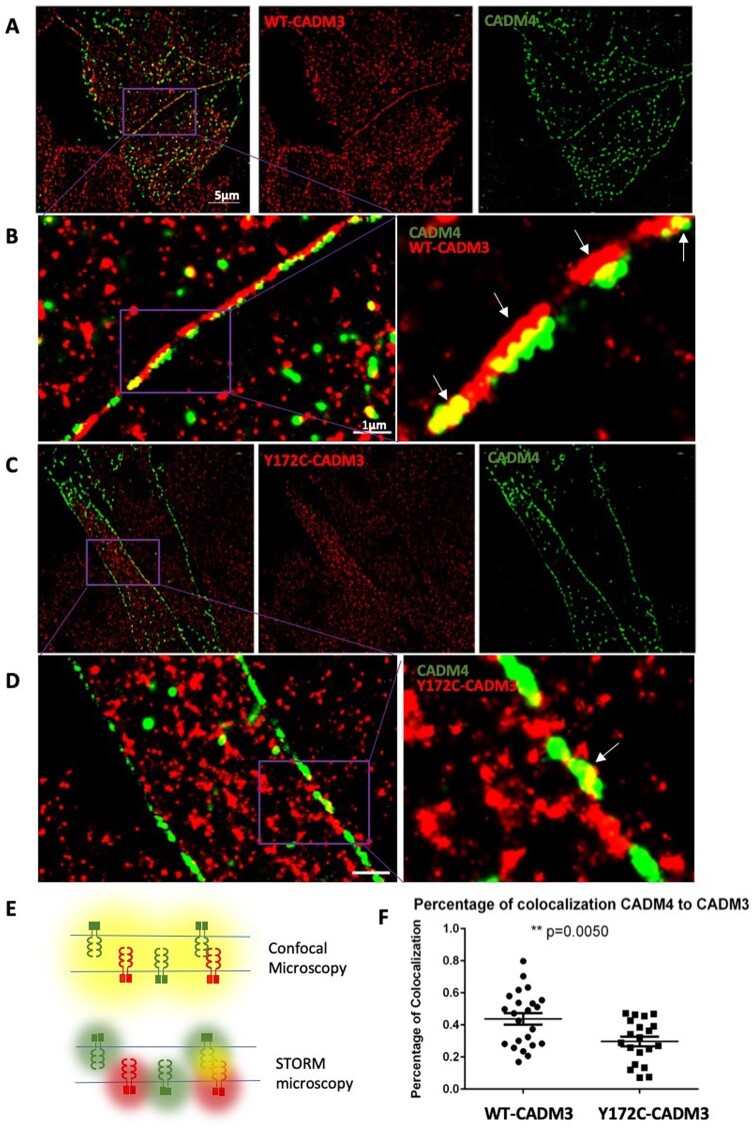
Figure 5.
Super-resolution microscopy shows CADM3 co-localization with CADM4 at plasma membrane contact sites. (A and B) STORM imaging reveals close proximity between WT-CADM3 (red) and CADM4 (green) at cell-cell contact sites in L-cells, which lack cell-cell adhesion molecules. A representative image shows two distinct colour lines formed at cell contact sites with some co-localization overlapping between red and green. (B) Magnified views from regions demarcated by purple boxes. (C and D) Mutant Y172C-CADM3 shows less specific localization to the membrane and diminished co-localization with CADM4. (D) Magnified views from regions demarcated by purple boxes. (E) Illustration of different results obtained with conventional confocal microscopy and STORM imaging. Adjacent CADM molecules cannot be distinguished by conventional microscopy, which shows co-localization (yellow), while STORM is able to distinguish the molecules (red and green). (F) Quantification of co-localization between CADM4 and CADM3. Twenty images from each group were obtained to calculate the results (t-test, P < 0.005).

