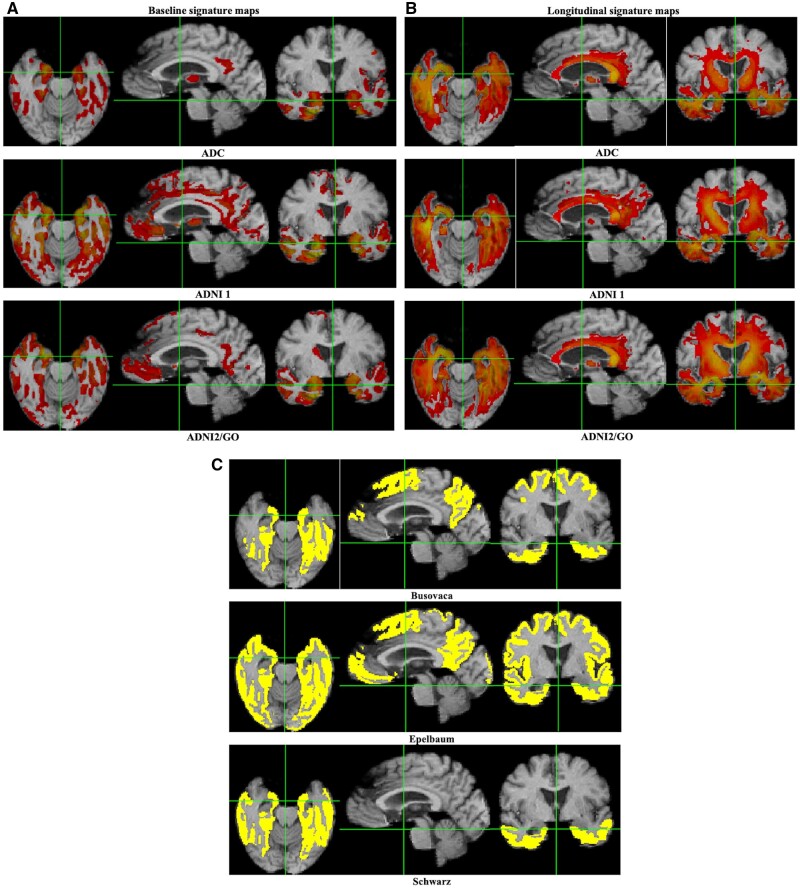
Figure 2.
Visualizing the signature regions of interest. Combined t-level cluster signature maps for associations of brain measures and episodic memory composite scores. (A) Baseline associations of grey matter density to memory intercept. (B) Longitudinal associations of brain atrophy rates with memory change. Colour maps are on the same scale of 3–8 (red to yellow) for baseline. Longitudinally, minimum values are 4 (red) and maximum values (yellow) vary by cohort. (C) Corresponding coordinate plane slices for comparison baseline model union regions of interest from Busovaca et al.,27 Epelbaum et al.15 and Schwarz et al.14

