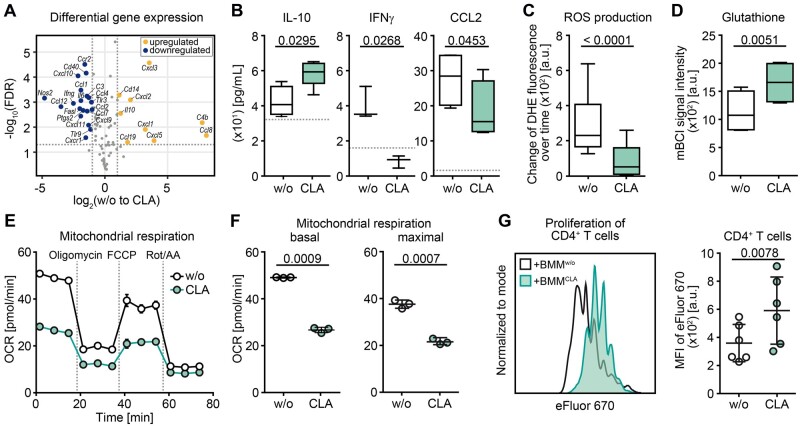
Figure 3.
CLA treatment enhances anti-inflammatory and suppressive features of myeloid cells in vitro. (A) Differential expression analysis of immune response-related genes via RT2 Profiler array is illustrated as a volcano plot of the false discovery rate (FDR) corrected P-values against fold change of untreated versus CLA-treated (50 µM of each isomer = CLA-mix) splenic CD11b+ (n = 4; blue = downregulated; yellow = upregulated). (B–G) BMMs were differentiated without or with 50 µM CLA-mix over 7 days. At least three independent experiments were performed for each readout. (B) Concentrations of secreted cytokines in cell supernatants were assessed by ELISA. Box plots display the median, interquartile interval of 95% (box) as well as minimum and maximum (whiskers) of pooled data (n ≥ 3 per group). Dotted lines indicate the detection limit. Characterization of (C) reactive oxygen species-production rate (DHE = dihydroethidium, n = 6) and (D) glutathione levels (mBCI = monochloromobimane, n = 4) in BMMs are shown. (E and F) Real-time measurement of oxygen consumption rate (OCR) in BMMs is shown as (E) graph of one example oxygen consumption rate measurement as well as (F) dot plots of basal and maximal respiration of one example experiment out of three independent experiments with in total six mice, whereas one dot represents one technical replicate. (G) Suppression assay with anti-CD3-activated splenic CD4+ T cells and differentiated BMMs was performed with or without CLA treatment (ratio 2:1). Left: Example MFI profile of eFluorTM 670 in CD4+ T cells of one experiment is shown. Right: Dot plot illustrates pooled data of MFI of CD4+ T cells, whereas each dot represents the mean of three technical replicates from BMMs generated from one individual mouse. Dot plots depict mean ± SD. Statistics: paired two-tailed Student’s t-test.

