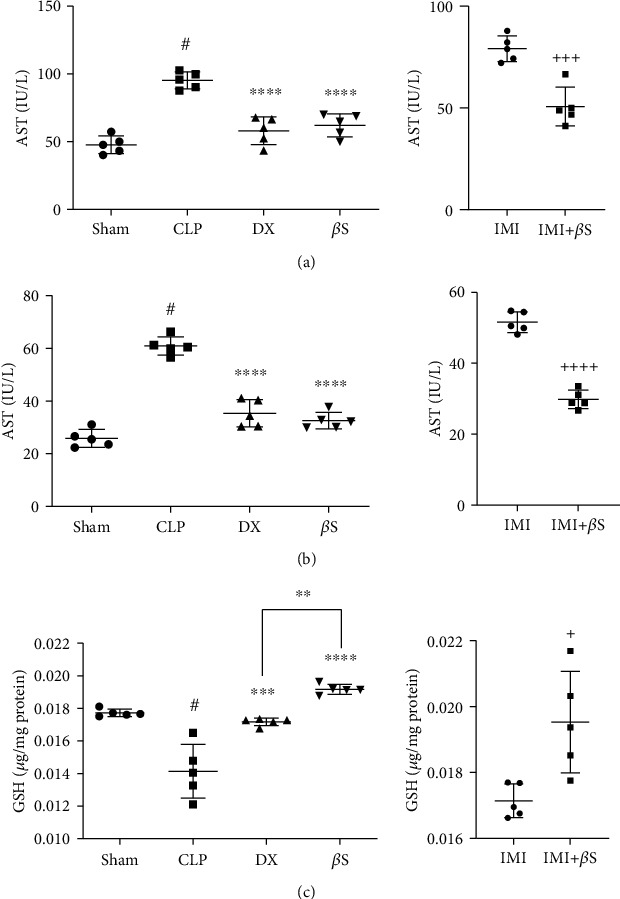
Figure 2.

Measurement of AST (a) and ALT (b) serum levels and GSH content of liver tissue (c) using ELISA (n = 5/group). Measurements were performed 48 h after surgery in the sham, CLP, DX, and βS groups, and 72 h after surgery in the IMI and IMI+βS groups. All data are expressed as the mean ± SD. Data were analyzed by ANOVA, followed by Tukey's post hoc test for sham, CLP, DX, and βS comparison. The IMI and IMI+βS groups were analyzed separately using unpaired t-test. #Significant difference compared with the sham group (p < 0.0001). ∗∗Significant difference compared with the DX group (p < 0.01). ∗∗∗Significant difference compared with the CLP group (p < 0.001). ∗∗∗∗Significant difference compared with the CLP group (p < 0.0001). +Significant difference compared with the IMI group (p < 0.05). +++Significant difference compared with the IMI group (p < 0.001). ++++Significant difference compared with the IMI group (p < 0.0001). βS: β-sitosterol; CLP: cecal ligation and puncture; DX: dexamethasone; IMI: imipenem.
