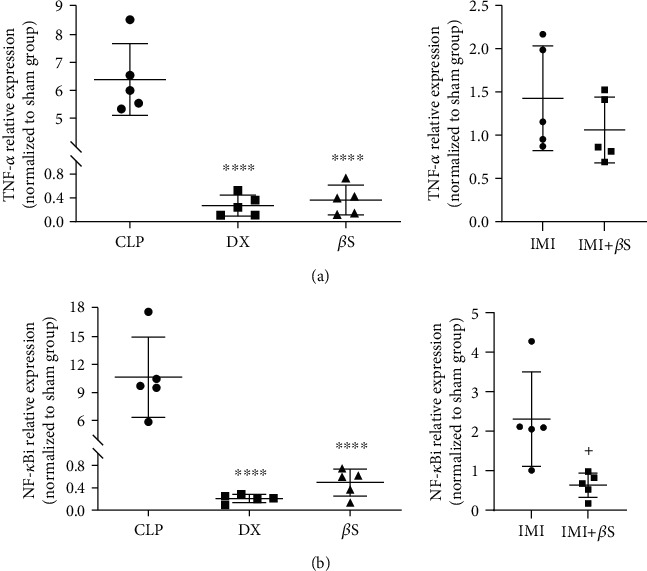
Figure 4.

mRNA expression of TNF-α and NF-κBi in liver tissue. TNF-α and NF-κBi mRNA expression was assessed using predeveloped assays for RT-qPCR. Values were calculated using a comparative CT method (2−ΔΔCT) according to the manufacturer's instructions. GAPDH was used as an internal control gene. Data are presented as the mean ± SD normalized to the sham group. Statistical analysis was performed using one-way ANOVA and Tukey's multiple comparisons test for sham, CLP, DX, and βS comparison. The IMI and IMI+βS groups were analyzed separately using unpaired t-test. ∗∗∗∗Significant difference compared with the CLP group (p < 0.0001). +Significant difference compared with the IMI group (p < 0.05). βS: β-sitosterol; CLP: cecal ligation and puncture; DX: dexamethasone; IMI: imipenem.
