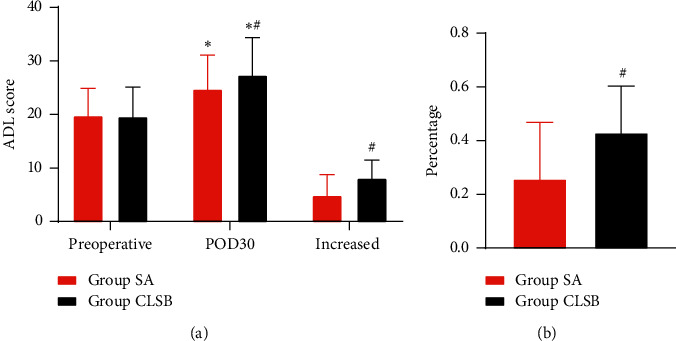
Figure 2.

ADL score, percentage of increased ADL scores between the two groups. (a) ADL scores of two groups. (b) Percentage of two groups. ∗P < 0.05, compared with preoperative ADL scores; #P < 0.05, the CLSB group compared with the SA group; ADL, activity of daily living; CLSB, combined lumbar and sacral plexus block; POD, postoperative day; SA, spinal anesthesia. A higher ADL score means a worse quality of life.
