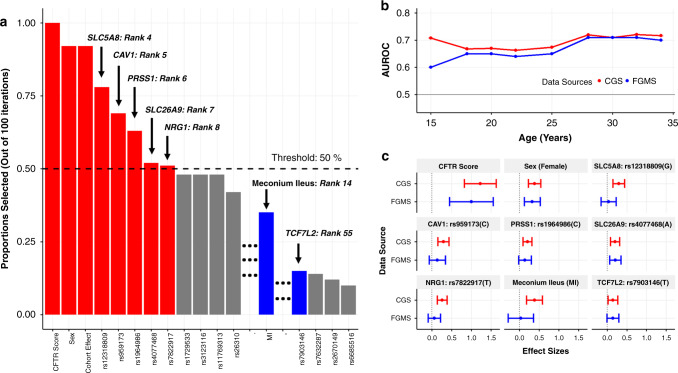
Fig. 1. Feature selection and model performance for the cystic fibrosis–related diabetes (CFRD) prediction model.
(a) Stability selection and component-wise gradient boosting with 100 iterations. Black dashed line: predefined threshold at 50% of iterations. Red: predictors exceeding stability selection threshold. Blue: meconium ileus (MI) and rs7903146 (TCF7L2), previously shown to be associated with immunoreactive trypsinogen (IRT) at birth and type 2 diabetes, respectively, ranked highly among the predictors. Over 96% of the 2,488 predictors were chosen in <10% of the 100 iterations; they are not shown. (b) Model performance in the Canadian CF Gene Modifier Study (CGS) and French CF Gene Modifier Study (FGMS) calculated by area under the receiver operating characteristic curve (AUROC) as a function of age in years. Model was trained and internally cross-validated in the CGS and externally validated in the FGMS cohort. The 95% confidence intervals of the average AUC(t) are shown in the CGS through bars. (c) Forest plots depicting univariate log hazard ratios estimated from the CGS and FGMS studies. The vertical dotted line represents a log hazard ratio equal to 0.

