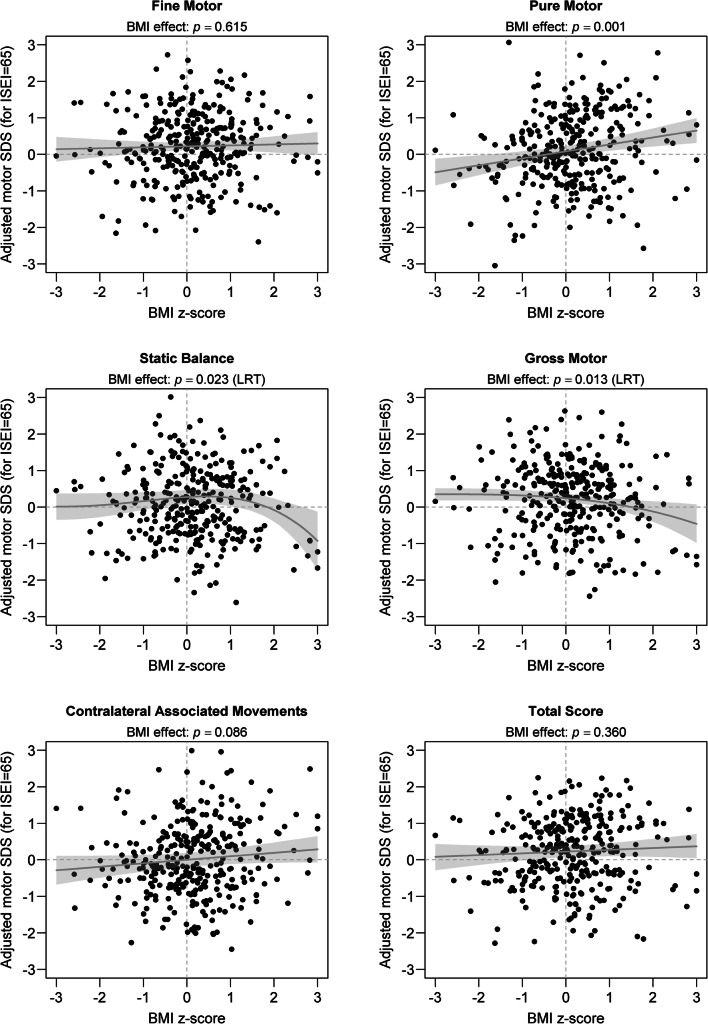
Fig. 1.
Adjusted motor SDS in ZNA-2 components and total score as a function of BMI z-scores. For illustrative purposes, the predicted difference between the actual ISEI and a median ISEI of 65 points is subtracted from each motor score. Dots refer to the adjusted motor scores, observed or imputed from the first complete dataset. The grey line represents predicted motor scores as calculated after pooling regression coefficients from the 50 complete datasets. The light grey area represents a 95% confidence interval around the regression line. For linear effects, the reported p values refer to testing for nullity of the slope of the regression line. The p values reported for nonlinear effects (Static Balance and Gross Motor) were obtained using a likelihood ratio test (LRT)

