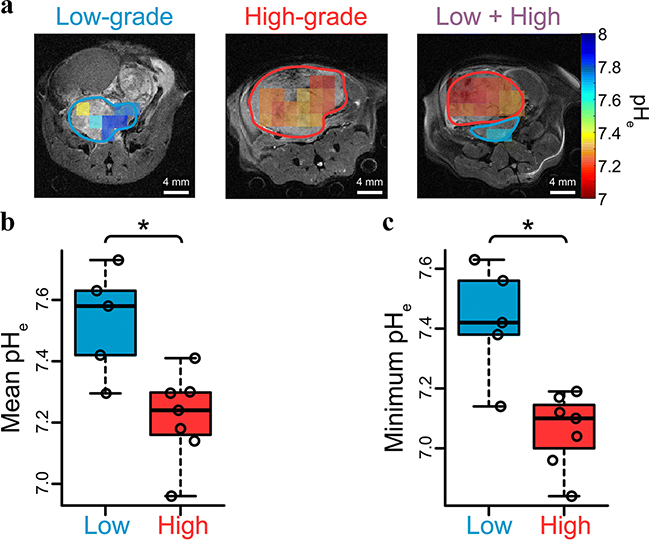
Figure 4.
DNP-MRS imaging the interstitial pHe of TRAMP mice using HP H13CO3− demonstrates decreases in tumor pH associated with high grade disease. (A) HP 13C pHe images of low-, high-, and separate distinct low- and high-grade tumors in the same TRAMP mouse. High grade tumor regions verified at pathology are circled in red, and low grade regions circled in blue. (B) and (C) scatter plots demonstrating the significant difference of pHe between low- and high-grade regions over all mice on mean and regional-minimum (*p < 0.05).

