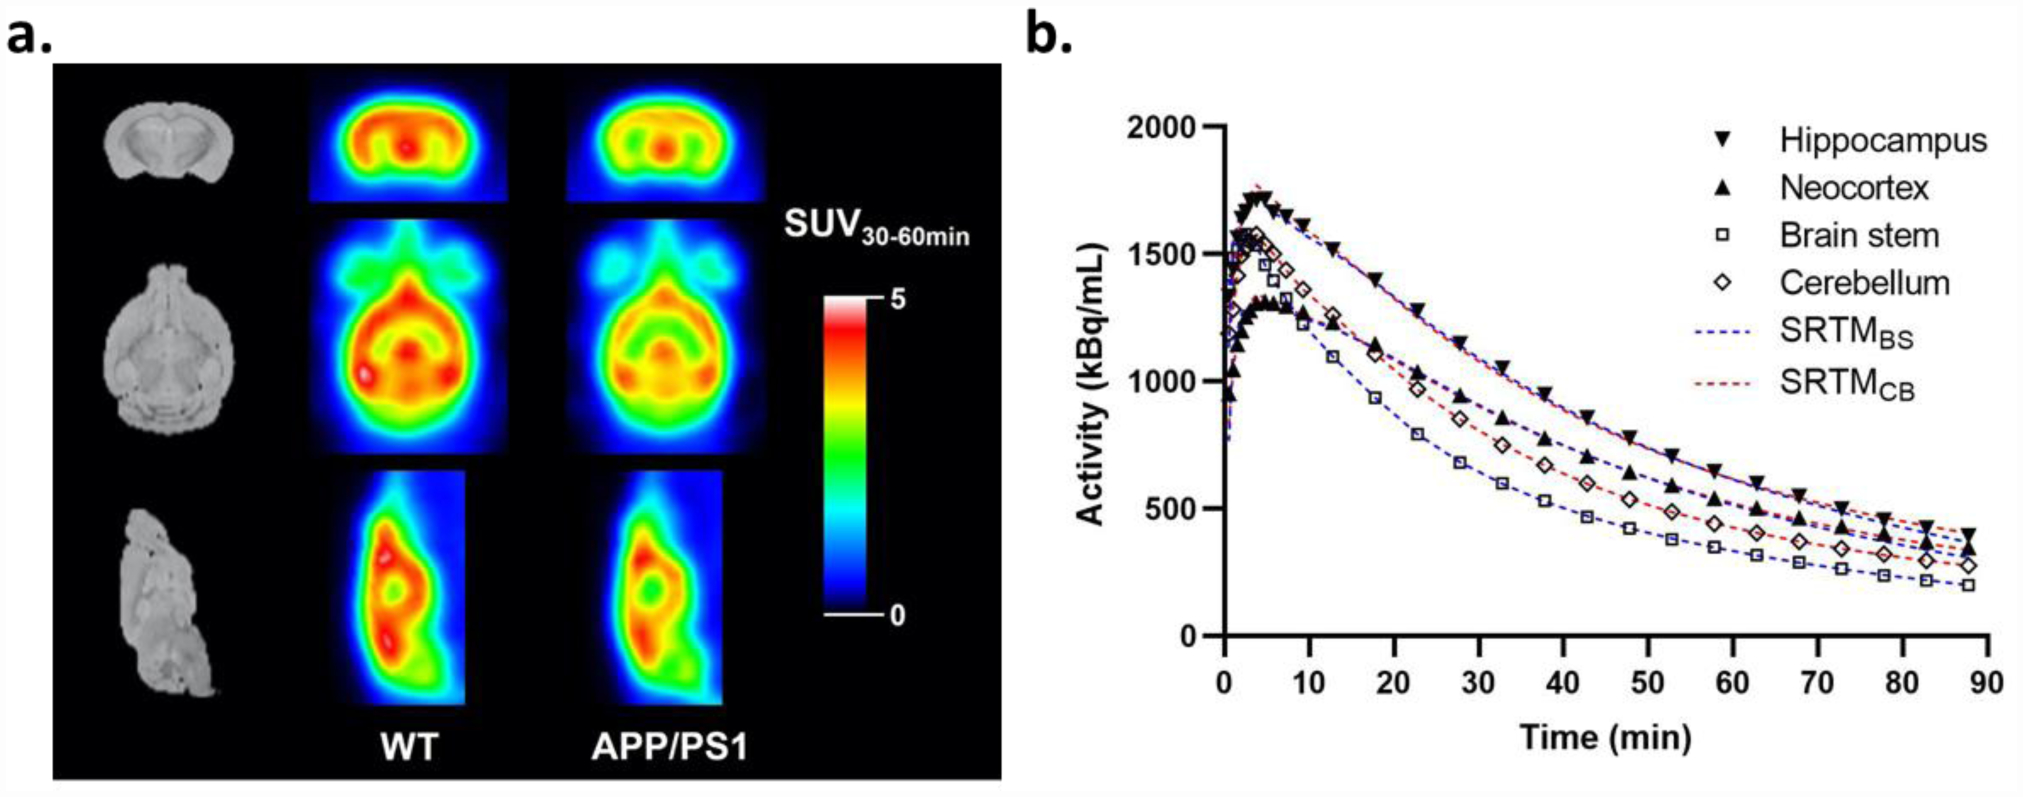
Figure 2.

(a) Representative summed coronal (top row), axial (middle row), and sagittal (bottom row) SUV images of [18F]SynVesT-1 (from 30–60 min) in WT (middle column) and APP/PS1 mouse brains (right column), with anatomical MR images in Ma-Benveniste-Mirrione mouse brain atlas (left column) as anatomical reference. (b) Time-activity curves of regional brain radioactivity in hippocampus, neocortex, brain stem (BS) and cerebellum (CB). Dotted lines show curve fitting with SRTM using either BS (blue) or CB (red) as reference region.
