
Figure 2. Trajectories of HDL conventional and composition metrics over the menopause transition.
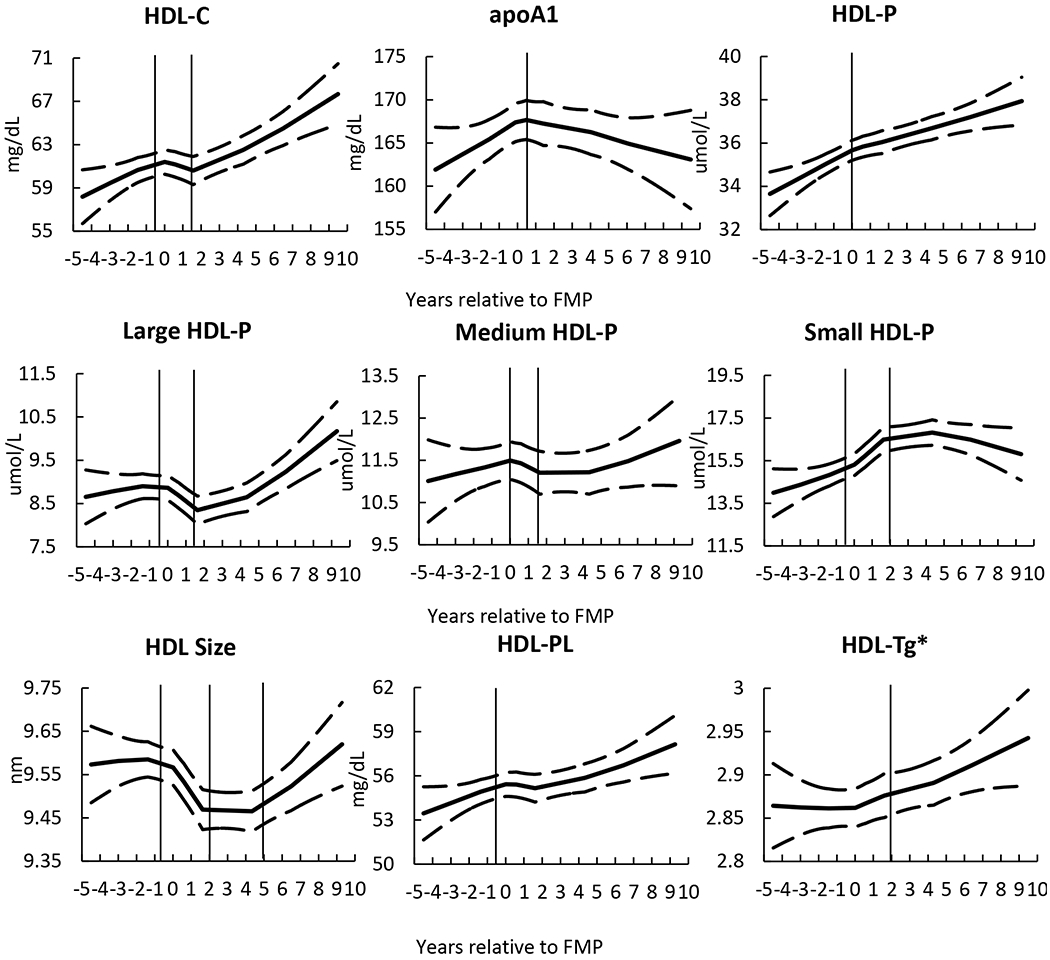
Although HDL-C increased over the MT, measures of HDL subclasses and lipid content showed changes consistent with major remodeling effects of HDL- Vertical lines represent identified inflection points demarcating 3 stages (for metrics with 3 segments): pre-, peri-, and postmenopause for 2 stages (for metrics with 2 segments): pre-/peri-, and postmenopause. Solid line is the locally weighted smoothing (LOESS) results and dash lines are upper and lower 95% confident interval. The number of observations (Sample size: 1,197 to 1,217 observations, varied by HDL metrics) was restricted to 5 years before FMP and 10 years after FMP to reduce the variability due to limited sample size at two ends.
* HDL-Tg is log transformed
apoA1: apolipoprotein A1; FMP: final menstrual period; HDL-C: high-density lipoprotein cholesterol; HDL-P: high-density lipoprotein particles; HDL-PL: high-density lipoprotein phospholipids; HDL-Tg: high-density lipoprotein triglycerides.