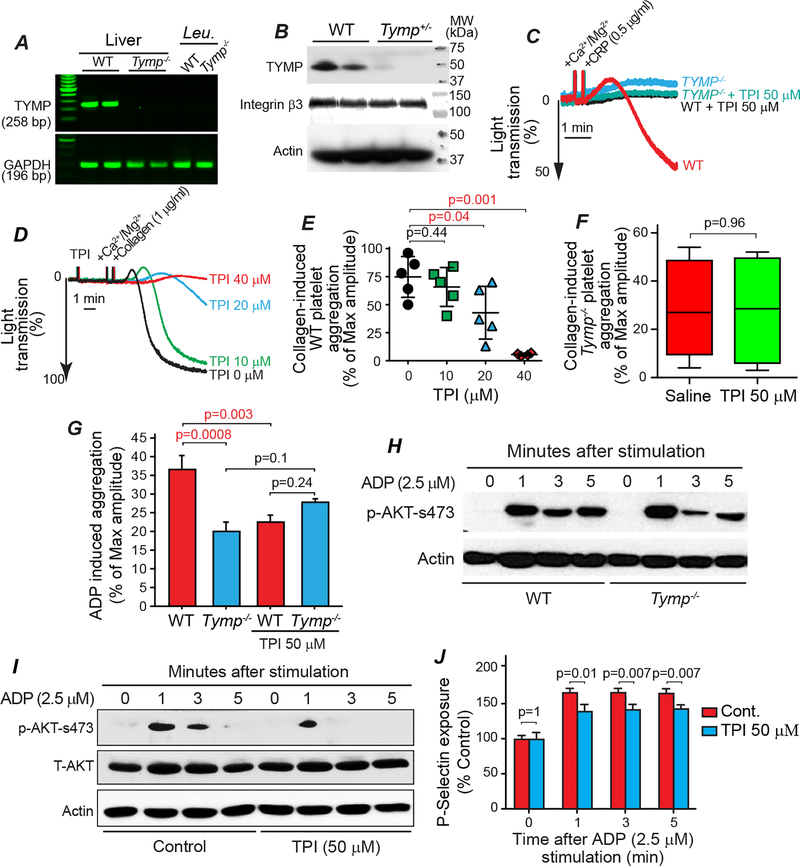
Fig. 3. Inhibition of TYMP in vitro inhibits platelet activation.
A. Whole blood were drawn from 6 WT and 6 Tymp–/– male mice and platelet-rich plasma (PRP) was separated by centrifugation. The bottom 1/3 of the PRP and the buffy coat were pooled together, treated with red blood cell lysis buffer, and the nucleated cells were collected and used for RNA extraction. RT-PCR was used to examine TYMP expression in the mRNA level. Liver RNAs were used as positive control. Leu. = leukocytes. B. TYMP expression in the WT and Tymp+/− platelets were examined by western blot. Integrin β3 and actin were reblotted as loading control. C. WT and Tymp–/– platelets in PRP were treated with 50 μM TPI for 2 min and then CRP-induced platelet aggregation was assessed. D & E. WT platelets in PRP were treated with different concentration of TPI for 2 min and then collagen (1 μg/ml) induced platelet activation was assessed. F. Tymp–/– platelets in PRP were treated with saline or 50 μM TPI in saline for 2 min and then collagen-induced platelet aggregation was assessed. N=5 in each condition. G. WT and Tymp−/− platelets in PRP were treated with 50 μM TPI for 2 min and then 2.5 μM ADP-induced platelet aggregation was assessed. H. WT and Tymp–/– platelets in PRP were treated with 2.5 μM ADP for the indicated times and then AKT activation were evaluated. Blot represents two repeats. I. WT platelets in PRP pooled from 10 mice were divided into 8 parts. Four parts were treated with 50 μM TPI and another 4 parts were treated with saline as controls before they were treated with 2.5 μM ADP for the indicated times. Platelet lysates were used for assessing AKT phosphorylation. J. WT platelet in PRP were divided into 8 groups, treated with saline or 50 μM TPI, and then treated with 2.5 μM ADP for the indicated times. Platelet surface p-selectin exposure was analyzed by flow cytometry and data were shown as ratio of control (0 minute). N=3.

