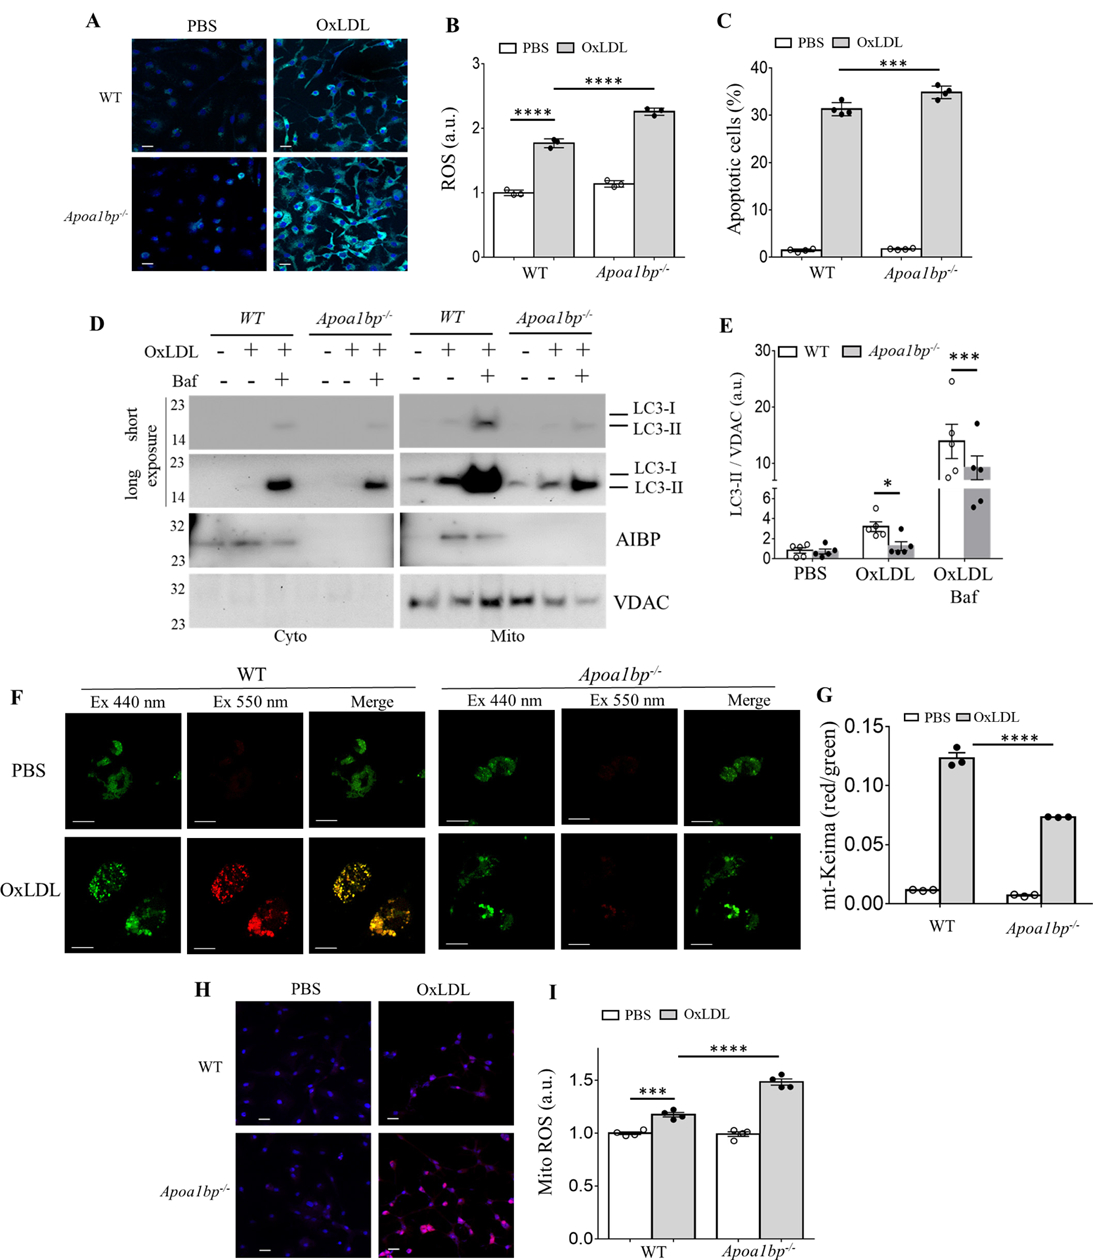
Figure 4.

Macrophage AIBP regulates OxLDL-induced ROS, apoptosis and mitophagy. BMDM isolated from WT and Apoa1bp−/− mice were incubated with PBS or 25 μg/ml OxLDL for 24 h and ROS generation was measured using (A) a confocal microscope or (B) flow cytometer. Geometric means of FACS histograms were measured and presented as scattered bar graphs. (C) Apoptotic cells were detected by Annexin V staining using a flow cytometry analysis. (D-E) LC3-II and AIBP expression in isolated mitochondria were measured by immunoblot. (F-G) BMDM were infected with retrovirus encoding mt-Keima for 24 h and incubated with PBS or 25 μg/ml OxLDL for additional 24 h. Mitophagy flux was analyzed by confocal microscopy, capturing images at both 440nm (green, mitochondria) and 550nm (red, lysosome) (F), and flow cytometry (G). Mitochondrial ROS were measured using (H) confocal microscopy and (I) flow cytometry. Mean±SEM; N=3–5. *, p<0.05; **, p<0.005; ***, p<0.0005; ****, p<0.0001. Scale bars, 20μm in A and H, 10μm in F.
