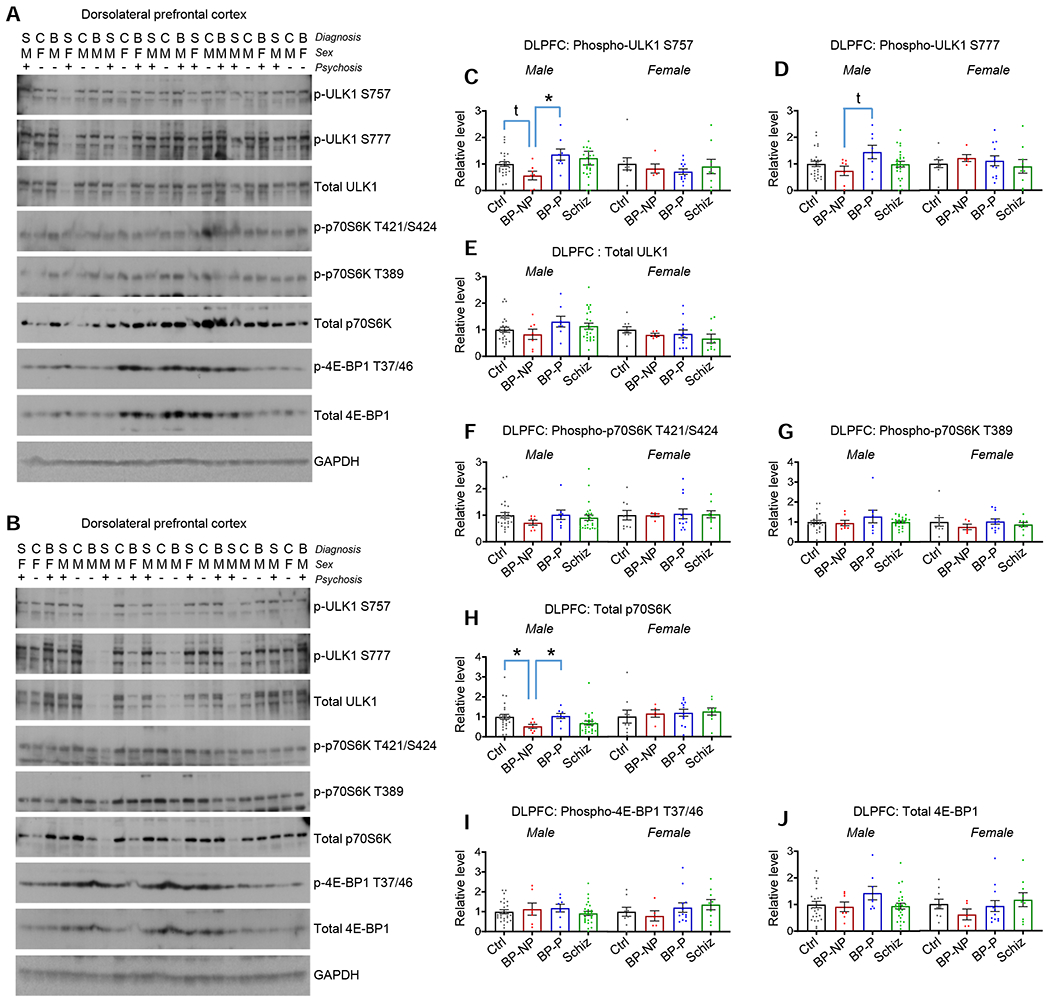
Figure 2. Protein levels and activity of downstream mTOR effectors in bipolar disorder and schizophrenia DLPFC.

A and B. Blots show phospho and total levels of ULK1, p70S6K, and 4E-BP1 in DLPFC homogenates. Diagnosis (S=schizophrenia, C=control, B=bipolar disorder), sex (M=male, F=female), and absence (−) or presence (+) of psychosis indicated. Figure S2 for the remaining blots.
C. p-ULK1 (S757) in DLPFC homogenates. *p<0.05 with multiple comparison correction; t=p<0.05 with direct comparison. Table S2 for statistical details.
D. p-ULK1 (S777) in DLPFC homogenates. t=p<0.05 with direct comparison. Table S2 for statistical details.
E. Total ULK1 in DLPFC homogenates. No differences between groups detected. Table S2 for statistical details.
F. Phospho-p70S6K (T421/S424) in DLPFC homogenates. No differences between groups detected. Table S2 for statistical details.
G. Phospho-p70S6K (T389) in DLPFC homogenates. No differences between groups detected. Table S2 for statistical details.
H. Total p70S6K in DLPFC homogenates. *p<0.05 with multiple comparison correction. Table S2 for statistical details.
I. p-4E-BP1 (T37/46) in DLPFC homogenate. No differences between groups detected. Table S2 for statistical details.
J. Total 4E-BP1 in DLPFC homogenates. No differences between groups detected. Table S2 for statistical details.
Summary data are the mean+SEM. n=35 control (26 male, 9 female), 12 BP-no psychosis (7 male, 5 female), 20 BP-psychosis (8 male, 12 female), 35 schizophrenia (26 male, 9 female)
