
Fig. 2|. Saccade task, event-related response maps and waveforms.
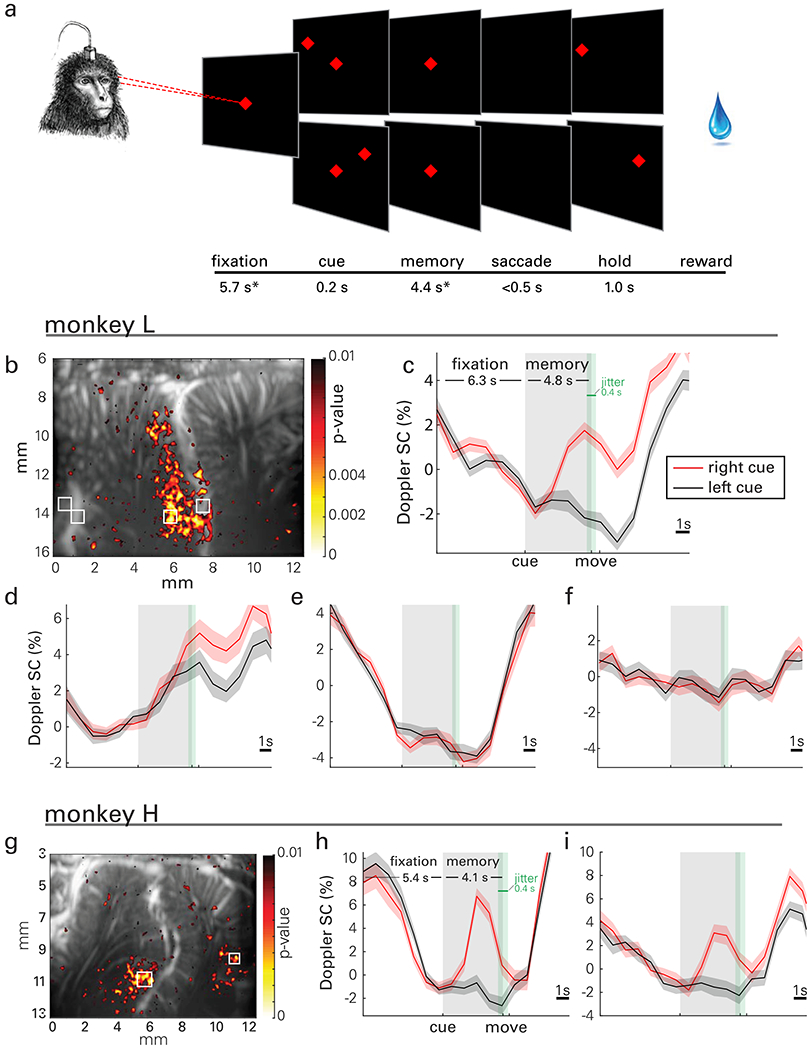
a, A trial started with the animals fixating on a central cue (red diamond). Next, a target cue (red diamond) was flashed either on the left or the right visual field. During a memory period, the animals had to remember its location while continuing to fixate on the center cue. When the center was extinguished (go-signal), the animals performed a saccade to the remembered peripheral target location and maintained eye fixation before receiving a reward. *Mean values across sessions shown; the fixation and memory periods were consistent within each session but varied across sessions from 5.4-6.3 and 4.0-5.1 s, respectively, depending on the animals’ level of training. The fixation and memory periods were subject to 400 ms of jitter (green shaded area, uniform distribution) to preclude the animal from anticipating the change(s) of the trial phase. b-f, Representative activity map and event-related average (ERA) waveforms of CBV change during memory-guided saccades for monkey L. g-i, Activity map and ERA waveforms for monkey H. b, A statistical map shows localized areas with significantly higher signal change (SC) (one-sided t-test of area under the curve, p<0.01) during the memory delay phase for right cued compared to left cued saccades, i.e., vascular patches of contralaterally tuned activity. c, d, ERA waveforms in LIP display lateralized tuning specific to local populations. e, Small vasculature outside of LIP exhibits event related structure that is tuned to task structure but not target direction. f, Vessels that perfuse large areas of cortex do not exhibit event related signal. g, Map for monkey H. h, ERA waveforms show lateralized tuning in LIP. i, Target tuning also appears in medial parietal area (MP) for monkey H. Panels c-f share a common range (9% signal change) as do h-i (14%). ERAs are displayed as means across trials and shaded areas represent standard error (s.e.m.).