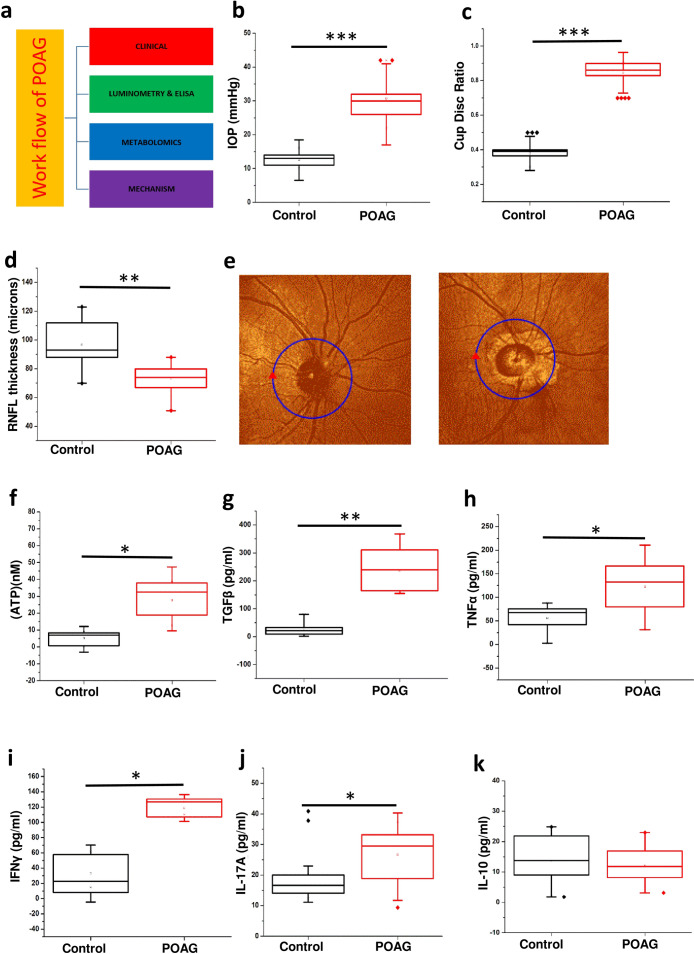
Figure 1.
Showing clinical parameters, elevated levels of ATP in aqueous humor and cytokine levels in plasma in POAG patients. (a) Work flow. (b) The IOP profile in POAG group compared to control. (c) The cup disc ratio (CDR) in POAG group compared to control. (d) Retinal nerve fiber layer thickness (RNFL) thickness in POAG patients compared to control eye. (e) Representative figure of OCT image showing the RNFL thickness in POAG patients compared to control eye. (f) Changes in the levels of ATP in aqueous humor of control and POAG patients. Cytokine profiling of (g) TGFβ (h) TNFα (i) IFNɣ (j) IL-17A and (k) IL-10 in blood plasma of control and POAG patients. In all the cases p values were calculated using Mann–Whitney U test. * for P < 0.05, ** for P < 0.01, and *** for P < 0.001. For n numbers and the results provided as mean ± s.d, refer to text. (a) was created using Microsoft office Professional Plus 2016 (version-2016).

