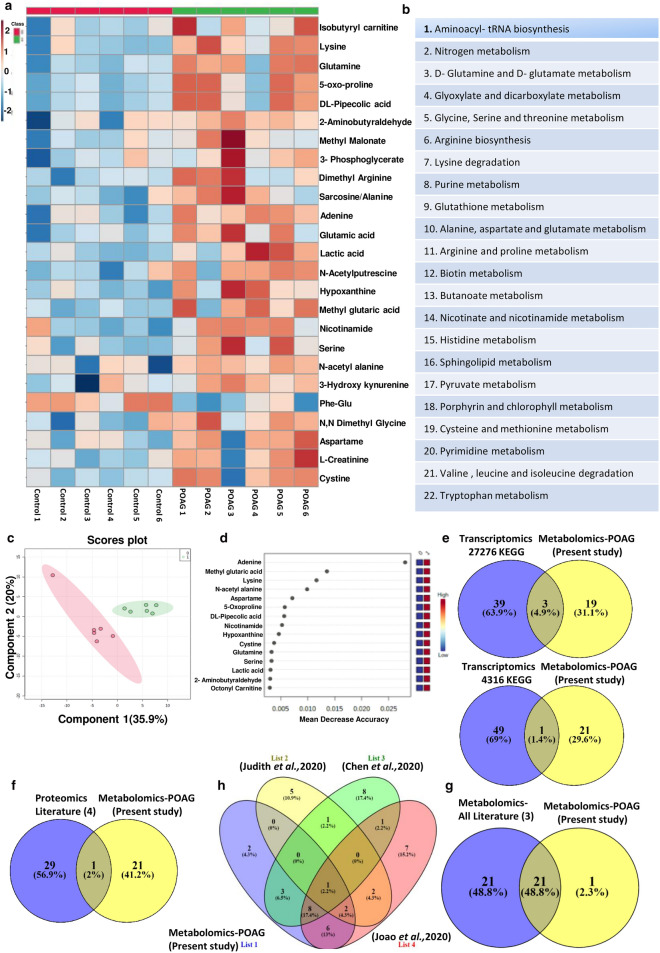
Figure 2.
Showing results of targeted metabolomics analysis of aqueous humor in POAG compared to controls. (a) Heat map of metabolomic analysis of control and POAG patient cohort. (b) List of pathways to which significant differential metabolites belong to POAG are binned at an FDR of 0.25. (c) Unbiased PLS-DA clustered the samples into two different group is represented by a score plot (d) showing Random Forest analysis distinguishing POAG from controls (e) showing overlap of metabolic pathways with transcriptomic data set (GSE27276 and GSE4316) using KEGG (f) Comparative analysis of proteomic data (Literature) with metabolomic data (present study) showing one conserved pathway. (g) showing overlap of 21 pathways between metabolomics data (present study) and metabolomics (Literature) (h) Flower model Venn diagram showing overlapping pathways among metabolomics data from present study and those from Literature. (a,c,d) was generated using MetaboAnalyst 5.0 (Version-5.0; URL link: https://www.metaboanalyst.ca/). (e–h) was created using VENNY2.1 (Version-2.1; URL link: https://bioinfogp.cnb.csic.es/tools/venny/).

