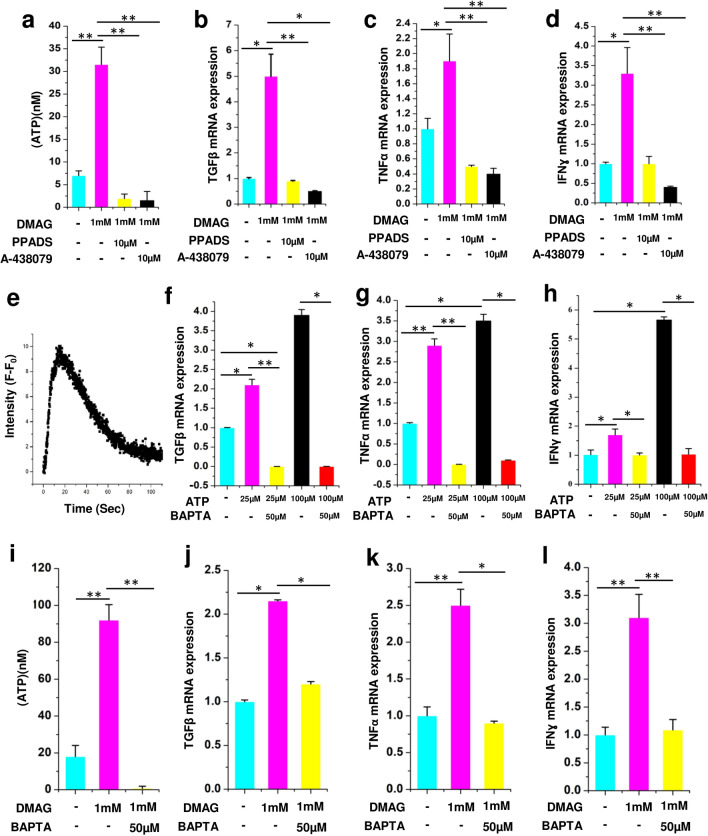
Figure 4.
Showing DMAG induced ATP secretion and expression of cytokines as well as their modulation by P2 receptor inhibitors and calcium chelator, ATP induced calcium response, cytokine expression, modulation by calcium chelator, (a–d) DMAG treated N9 cells with or without pre-incubation with PPADS (10 μM) or A-438079 (10 μM) showing (a) treated with DMAG inducing the secretion of ATP which is inhibited by PPADS or A-438079. (b) TGFβ (c) TNFα (d) IFNɣ. Showing ATP (100 μM) treated N9 cells (e) Elevated intracellular calcium time in seconds along X-Axis and Intensity (F − F0) which is base line fluorescence subtracted from observed fluorescence along Y axis. Expression of cytokines by N9 microglial cells treated with ATP (25 μM or 100 μM) in the presence or absence of BAPTA (50 μM) showing (f) TGFβ (g) TNFα (h) IFNγ. DMAG (1 mM) treated N9 cells with or without pre-incubation with BAPTA (50 μM), showing (i) secretion of ATP and inhibition by BAPTA. (j) TGFβ (k) TNFα (l) IFNɣ. The significance was calculated using Student T- test. *for P < 0.05, ** for P < 0.01, and *** for P < 0.001. For n numbers and the results provided as mean ± SEM, refer to text.

