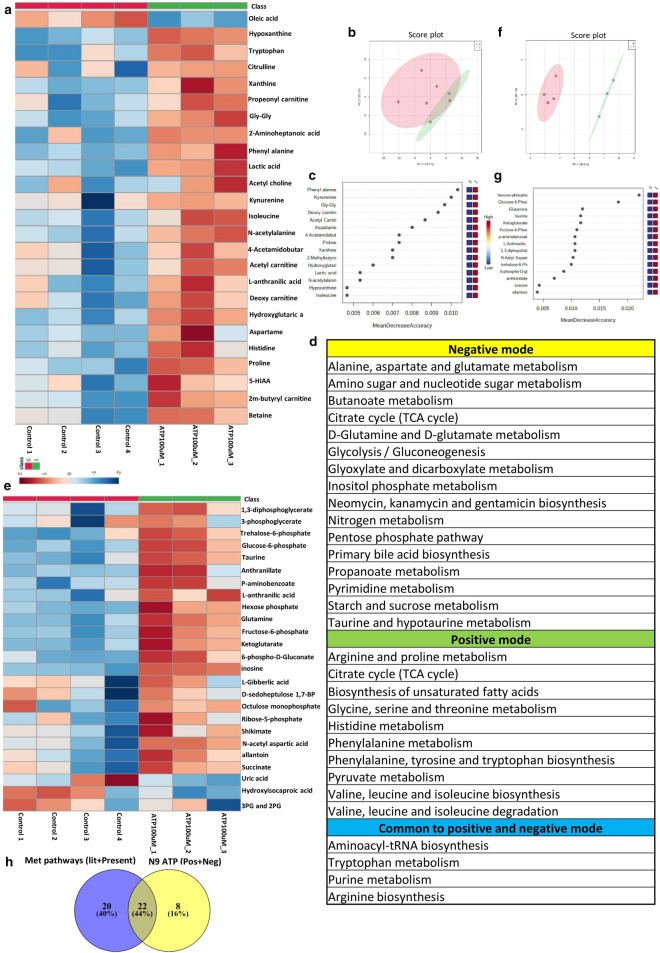
Figure 5.
Showing results of targeted metabolomics analysis of cell culture supernatant of N9 cells treated with ATP100μM in positive and negative mode. Metabolomic analysis of ATP (100 μM) treated N9 cells analyzed in the positive mode showing. (a) Showing heat map of significant differential metabolites between control sets and ATP (100 µM) treated sets in positive mode. (b) Unbiased PCA clustering of control (red color) and ATP (100 µM) treated (green color) sets in positive mode as represented by a score plot. (c) Random Forest analysis. (d) List of pathways to which differential metabolites belong to are obtained at an FDR of 0.25 in both positive and negative mode and common to both positive and negative. (e) Showing heat map of significant differential metabolites between control sets and ATP (100 µM) treated sets in negative mode. (f) Unbiased PCA clustering of control (red color) and ATP (100 µM) treated (green color) sets in negative mode as represented by a score plot. (g) Random Forest analysis. (h) Overlapping metabolic pathways between POAG and N9 cell culture supernatant. (a–c) and (e–g) was generated using MetaboAnalyst 5.0 (Version-5.0; URL link: https://www.metaboanalyst.ca/). (h) was created using VENNY 2.1(Version-2.1; URL link- https://bioinfogp.cnb.csic.es/tools/venny/).

