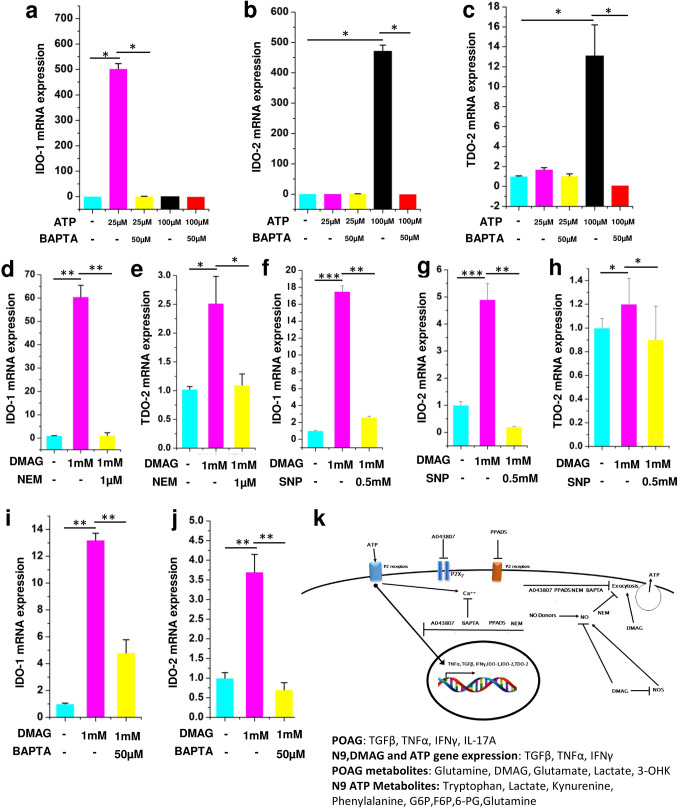
Figure 6.
ATP and DMAG induced tryptophan pathway gene expression and their modulation by BAPTA, NEM and SNP respectively. Showing ATP (25 μM or 100 μM) treated N9 cells or those pre-incubated with BAPTA (50 μM) before treating with ATP showing (a) IDO-1 (b) IDO-2 (c) TDO-2. DMAG (1 mM) treated N9 cells with or without pre-incubation with NEM (1 μM) (d) IDO-1 (e) TDO-2. DMAG (1 mM) treated N9 cells with or without pre-incubation with SNP (0.5 mM) (f) IDO-1 (g) IDO-2 (h) TDO-2. DMAG (1 mM) treated N9 cells with or without pre-incubation with BAPTA (50 μM) (i) IDO-1 (j) IDO-2. (k) Showing overall mechanism. The significance was calculated using Student T-test. *for P < 0.05, ** for P < 0.01, and *** for P < 0.001. For n numbers and the results provided as mean ± SEM, refer to text. Figure 6 k was created using Microsoft office Professional Plus 2016 (version-2016).

