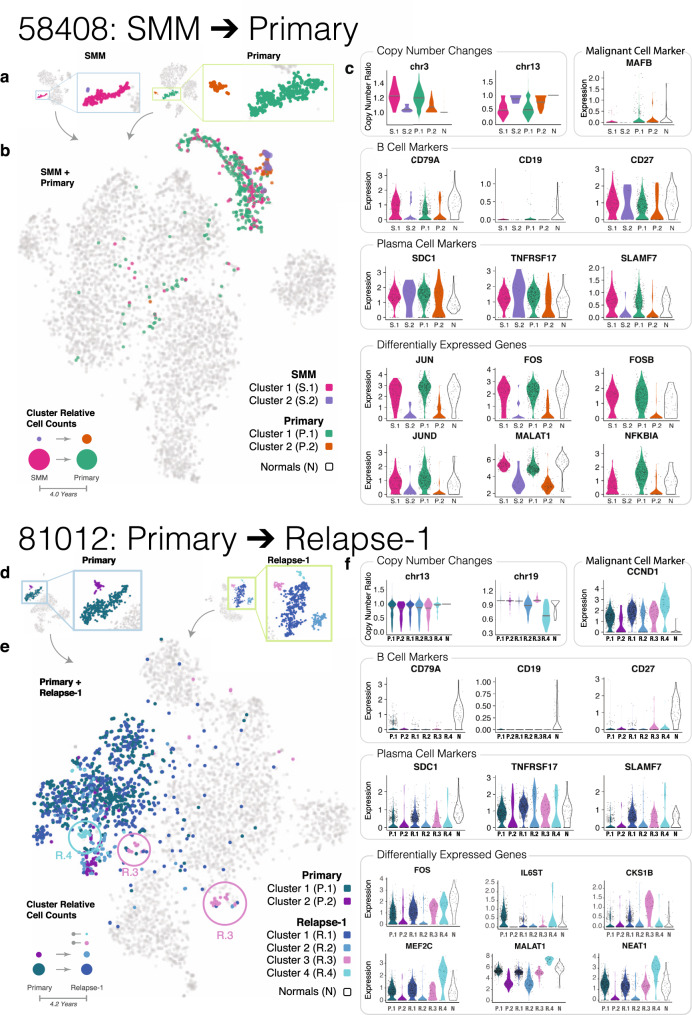
Fig. 4. Patterns of plasma cell subpopulation shift from SMM to Primary (58408) and from Primary to Relapse (81012).
a Plasma cell t-SNE subclusters for Patient 58408 at SMM and Primary time points. b Plasma cell subclusters identified in a mapped to the integrated t-SNE of all cells from Patient 58048 SMM and Primary time points. Bottom left: possible explanation for plasma cell subpopulation shift from SMM to Primary. c Copy number and expression patterns for plasma cells from different time point subclusters and plasma cells from healthy donors. The first row shows copy number changes and expression of genes associated with genetic alterations detected in Patient 58408. The second and third rows show the expression of B cell markers and plasma cell markers. The last two rows show differentially expressed genes found between the clusters. d–f Similar illustrations as a–c except for Patient 81012, who progressed from Primary to Relapse-1.

