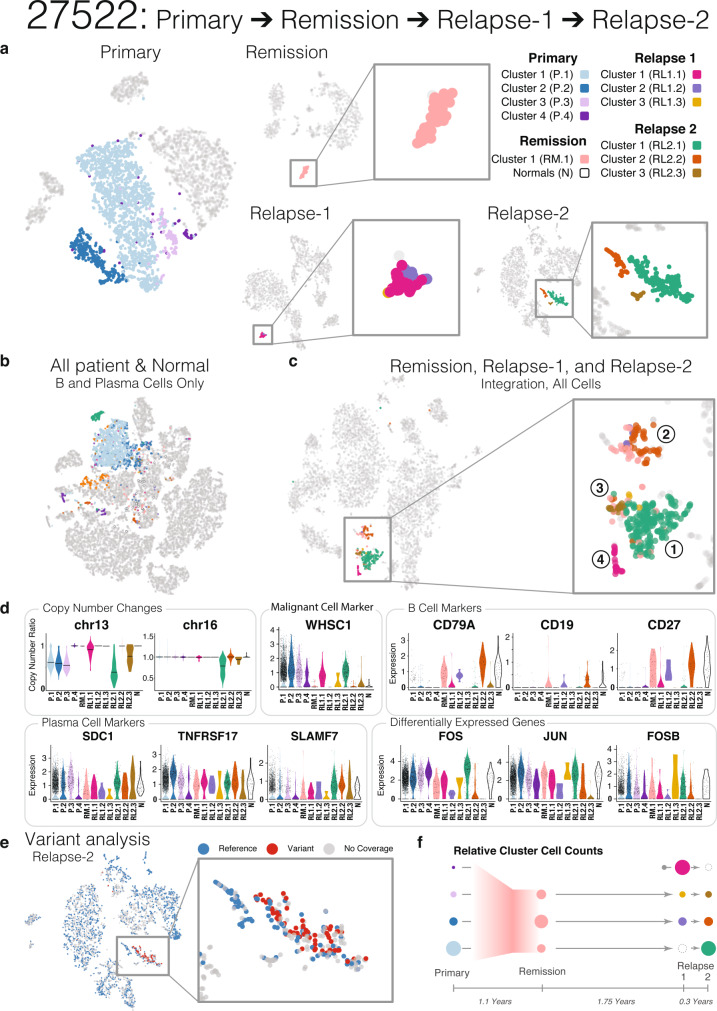
Fig. 5. Detailed analysis of plasma cell subpopulation shift for Patient 27522.
a t-SNE mapping of plasma cell subclusters for Patient 27522 at Primary, Remission, Relapse-1, and Relapse-2 disease stages. Colors indicate different subclusters within each time point. b Plasma cell subclusters identified in a mapped to the integrated t-SNE of b and plasma cells from all samples plus healthy donors (as in Fig. 3a). c Plasma cell subclusters identified in a mapped to the integrated t-SNE of all cells from Patient 27522 Remission, Relapse-1, and Relapse-2 disease stages. d Subcluster level copy number changes and expression of malignant cell markers, B cell markers, plasma cell markers, and differentially expressed genes. e Somatic mutations mapped onto Relapse-2 t-SNE (blue, reference allele only; red, variant allele detected; grey, no coverage). f Possible explanation for plasma cell subpopulation shift from Primary to Relapse-2.

